Locate the Low Center
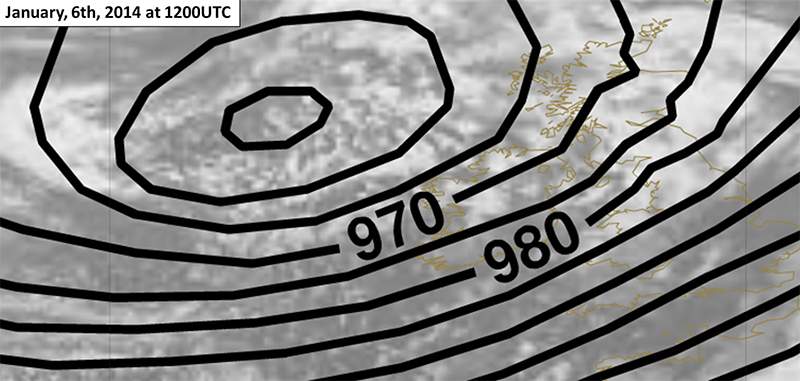
This case from January 2014 shows you how to use satellite products to monitor the sea state.
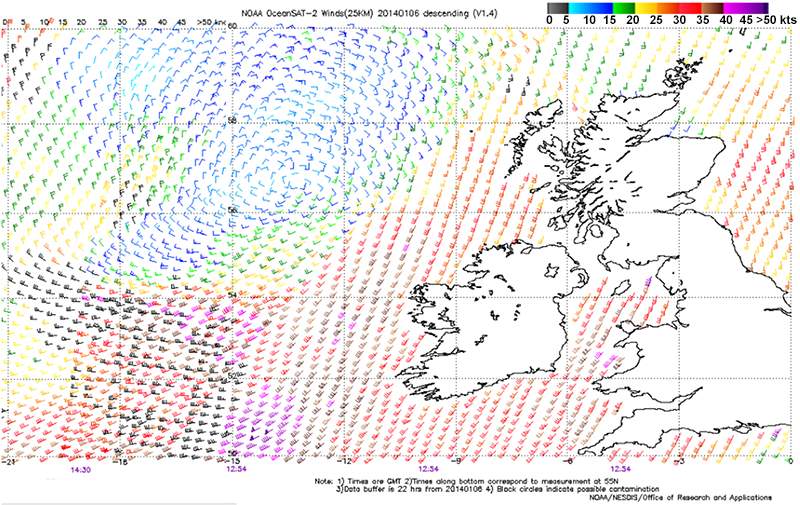
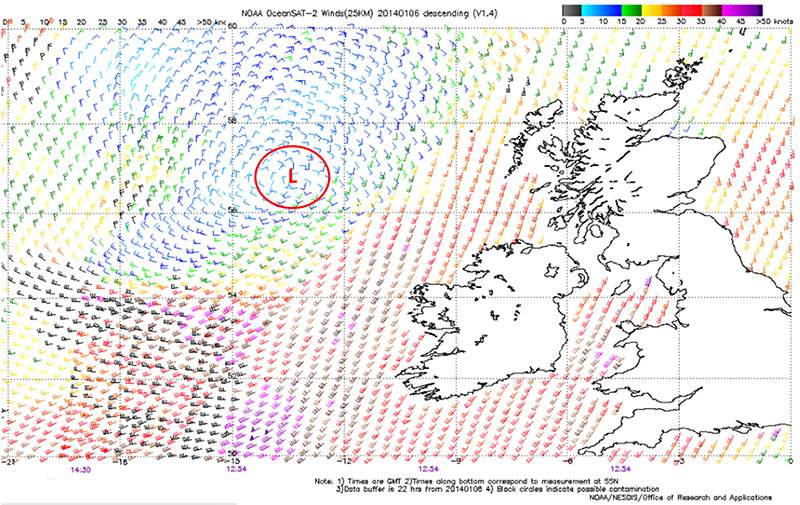
The map shows the ASCAT wind field at 10m above the ocean surface on 6 January 2014 west of Great Britain. Use the drawing tool to outline the center of the low on the image.
Question

| Tool: | Tool Size: | Color: |
|---|---|---|
The wind field shows a counterclockwise circulation, with winds weakening as they move towards the center of the low pressure system.

