Identify the Systems
This case study goes from 19 to 22 July 2015. This is a time when cold fronts and cut-off lows are prevalent in and around Southern Africa. To begin, view the animations in the tabs. Then answer the questions below.
Question 1
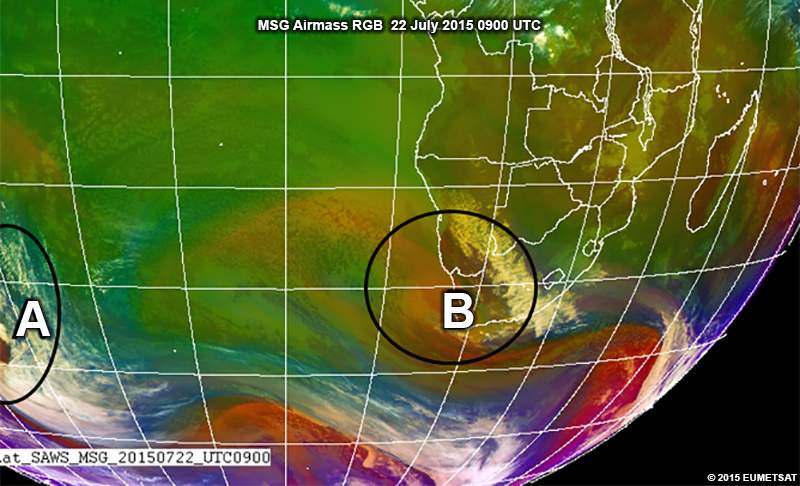
What systems dominate the weather in locations A and B? Choose all that apply.
The correct answers are A and C.
To identify a cold front, start by looking for the inverted/upside down comma shape in a cloud band. If you’re viewing an animation, you’ll also see a rotation in the southernmost part (SH) of the cloud band. Cold fronts are mostly found around 50 to 40 degrees south of the equator.
When looking for cut-off lows (COLs), remember that they’re upper air systems—which is why the airmass RGB is so helpful. To identify a COL, look for a rotation in the upper air humidity fields. The COL is often associated with a developing/thickening cloud band in the region of rotation. COLs are often found around 30-35 degrees S over South Africa. They can migrate further northward towards Namibia and Botswana.
Question 2
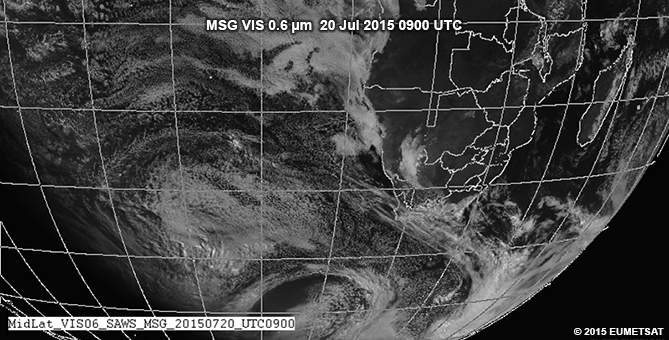
Use the drawing tool to draw the position of surface cold fronts on the image.
| Tool: | Tool Size: | Color: |
|---|---|---|
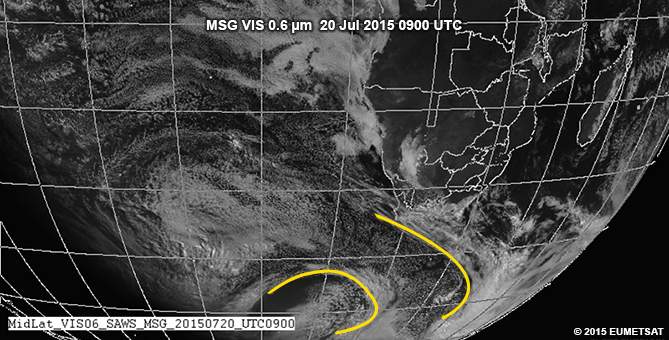
There are two cold fronts, each at a different stage of development. The front furthest east, touching the South African coastline, is marked by a clear band of thicker and colder cloud in an inverted comma shape. Directly west of this band is an extensive area of cold air cumulus. This is a good signal for cold air advection, which occurs west of a cold front. Note that the cloud ahead of the cold front band is fairly disorganized and is a mixture of mid, high and low level.
The front more to the west is in an earlier stage of development, and the cloud band associated with it is still fairly narrow and confined. This makes the front easy to identify. There’s also an area of cold air cumulus cloud to the west of this band.