Other Examples
The examples on this page show a cold front in a thick and broad band of cloud. You would need to use surface observations and upper air ascents (radiosonde) to determine the exact position. Click the tabs to view each example.
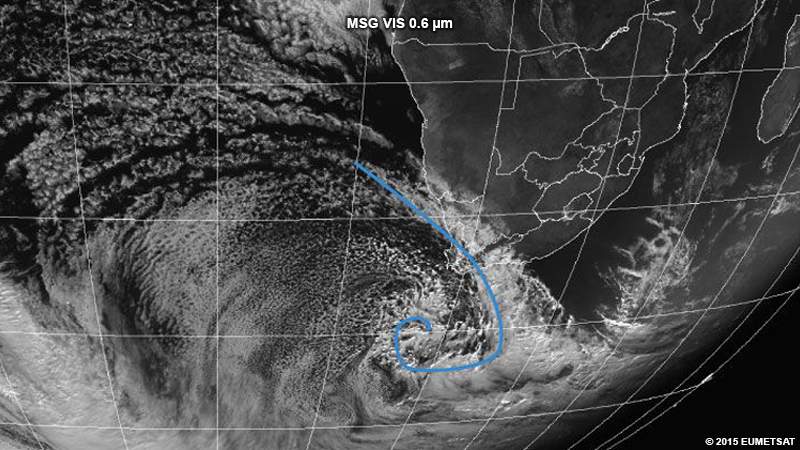
This example shows a fairly weak cold front with a poorly defined cloud band. To place the front boundary during analysis, look at the cloud over the south-western parts of South Africa. The “ripples” in the cloud are, in fact, mountain waves. Due to the orientation of the topography in that area, this means that north-westerly winds are persisting in the area, and confirms that the cold front is still approaching the region. Looking at local observations will also be very useful in this kind of scenario.
Placing the front over the ocean is more difficult due to the scarcity of surface observations. The frontal band generally appears in the area of thicker cloud since cold fronts as associated with convergence and the vertical development of cloud. It's useful to animate the imagery and look for where you see the low-level cloud rotating cyclonically into the vortex. Knowing your local topography is very important in this kind of case.
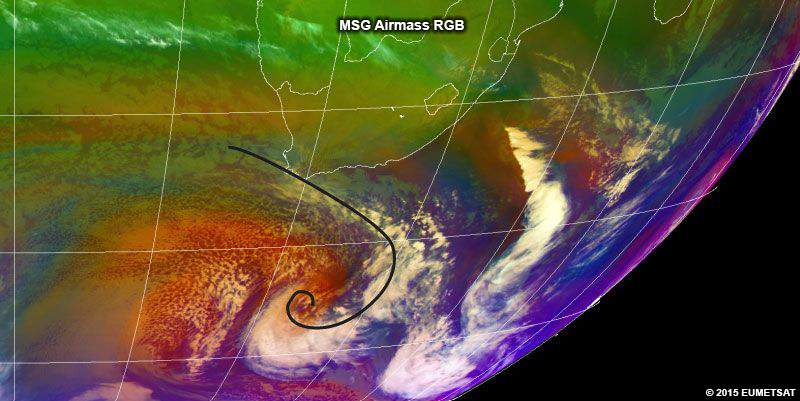
In this case, the upper trough and the cold front are in similar positions. The bright white/cold upper cloud band obscures the surface cold front. This is a very common occurrence and can cause the low-level front to be positioned as much as 100-200 km east or west of the actual location. A good starting point in such a case is to find the vortex of the cold front by animating the imagery over a few hours. Then look at the colour of the cloud on the airmass RGB. The bright white is your cold upper-level cloud. Often the warmer low-level cloud is visible below this as a yellow or green colour. In the animation, the upper cloud will move faster and be more transparent than the low-level cloud, and you’ll be able to distinguish between the two.
Since you're trying to find the low-level cold front, pay attention to the low-level cloud bands. Don't be tempted to follow the smooth edge on the western side of the upper level cloud shield to place the front.
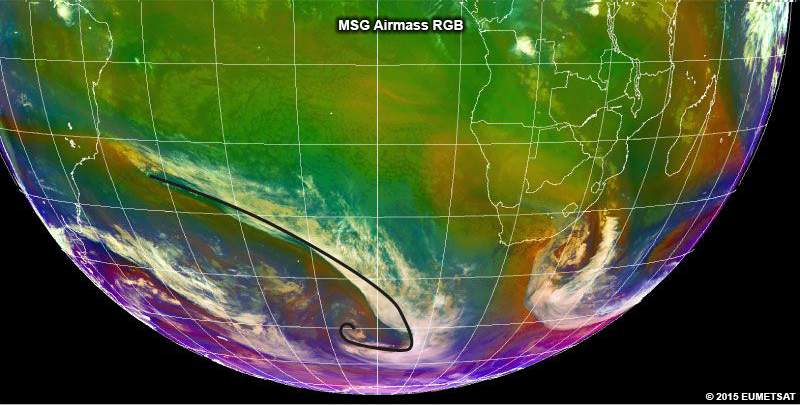
This example highlights the importance and value of using VIS imagery to determine cloud types and characteristics in placing low-level cold fronts. In this example, there are two possible cloud bands over South Africa that could be the low-level cold front. The band furthest east is not correct since it’s not a boundary between different air masses as per the definition of a low-level front. Rather, the front should be placed in the band of thickening clouds and to the west of the band (behind the front) where the open cumulus cells (cold air cumulus) are clearly seen. There’s also an upper air low associated with this cold front. The vortex of the cold front will be nearly impossible to place by just using VIS imagery. The airmass RGB can provide more insight in this scenario.