
Channel Selection
Table of Contents
Visible Channel (0.5-0.9 µm)
Visible Channel (0.5-0.9 µm) »Introduction
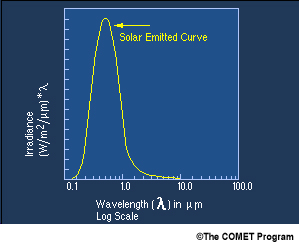
The visible channel is in the region of the electromagnetic spectrum where the sun emits most of its energy. That incoming energy is attenuated by molecules, clouds, and aerosols. About 50% of the incoming energy is either reflected or absorbed by the atmosphere and re-emitted to space. The remaining energy reaches the earths surface where it is either absorbed or reflected.
Visible Channel (0.5-0.9 µm) »Visible and AVHRR Channel 1 and 2 Comparison
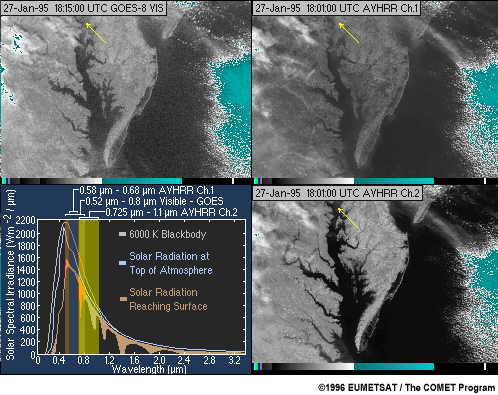
In this example, a GOES-8 visible image is compared to NOAA AVHRR channels 1 and 2. Notice the slight differences in wavelengths.
The GOES-8 visible image and the AVHRR channel 1 image are similar in brightness, while the AVHRR channel 2 image looks different.
The AVHRR 2 channel is centered at a longer wavelength where there is more reflection from vegetation and less from water. Vegetation in this channel appears bright while water appears dark.
Notice the difference in the brightness of water in the northern Chesapeake (yellow arrows), which indicates suspended sediments.
Visible channels similar to AVHRR channels 1 and 2 are available on Meteosat Second Generation satellites.
Visible Channel (0.5-0.9 µm) »Visible and AVHRR Channel 1 and 2 with Vegetation Index
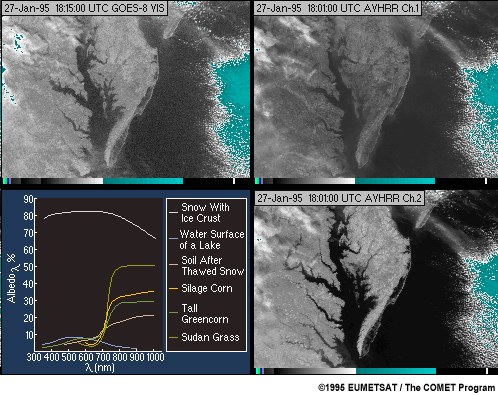
The graph on the lower left shows albedos for water and different types of vegetation. Reflection from vegetation increases with wavelength, with a marked change around 0.7 μm.
Notice that water is poorly reflective, with almost no reflection beyond 0.9 μm. The AVHRR channel 2 image appears brighter with more contrast because various surfaces have vastly different albedos.
Comparison of the GOES-8 image with the AVHRR images shows the result of the GOES-8 to GOES-12 visible channel extending out to 0.75 μm. Notice that as wavelength increases beyond 0.7 μm, land appears brighter while water becomes darker.
Turbid water is detectable in AVHRR channel 1, GOES visible imagery, and in the Meteosat Second Generation visible channel 1.
Increases in turbidity usually follow meteorological episodes such as strong flow across coastal zones or heavy rains and resultant runoff into rivers and lakes.
As mentioned earlier, visible channels similar to AVHRR channels 1 and 2 are available on Meteosat Second Generation satellites.
Visible Channel (0.5-0.9 µm) »Reflectance of Different Surfaces
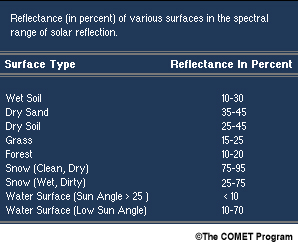
This table shows the reflectance of various surfaces. The visible channel is sensitive to those differences. Click on each Surface Type in the table to display its associated image.
Visible Channel (0.5-0.9 µm) »Sun Glint Over Water
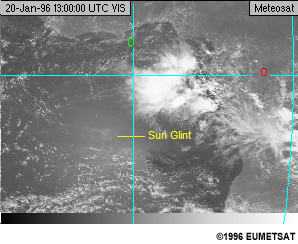
Sun glint is an important phenomenon that must be considered when viewing visible images over water areas. When water surfaces are smooth, reflections as large as 70% occur when the sun-ocean-satellite geometry is favourable. In the loop, notice the bright region that moves from east to west as the sun moves. The bright region is sun glint and indicates calmer seas.
Visible Channel (0.5-0.9 µm) »Scattering
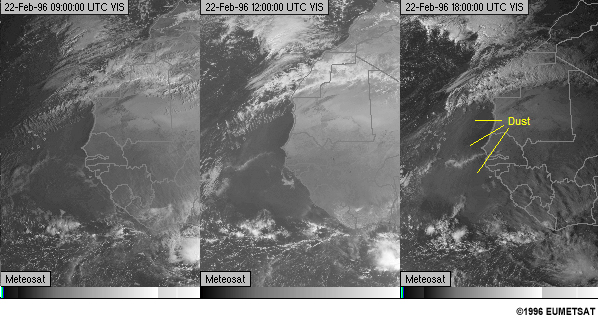
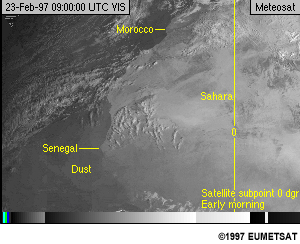
The dust in image 3 is readily apparent because dust, haze, and smoke __________ scatter more energy into satellite sensors in the late afternoon. Select the answer that completes the sentence.
The correct answer is B.
The geometric relationship of a low sun angle between the satellite and dust means that the dust particles forward scatter more radiation towards the satellite detectors.
Visible Channel (0.5-0.9 µm) »Summary
Summary:
- Meteosat First Generation: 0.5 to 0.9 µm
- Meteosat First Generation: Sampled at every 2.5 km east-west and south-north at sub-satellite point
- Meteosat Second Generation: VIS0.6 Ch.1 (0.56 to 0.71 µm) and VIS0.8 Ch.2 (0.74 to 0.88 µm)
- Meteosat Second Generation: Ch.1 and Ch.2 sampled at every 3 km east-west and south-north at sub-satellite point
- Sees scattered and reflected energy
- Daytime only
- Sees clouds and earth surface
- Senses haze, smoke, and dust early and late in day
- Sensitive to soil, water, and cloud type
- Sees fog in daytime
- Shadows useful for estimating heights of clouds
- Optimal use may require enhancement
- Used for tracking cloud features in time to estimate atmospheric motion
Infrared Channel (10.5-12.5 µm)
Infrared Channel (10.5-12.5 µm) »Introduction
The infrared window channel covers a portion of the atmospheric infrared window. At this wavelength, energy radiated by the earths surface and clouds is not significantly attenuated by atmospheric gases. In this channel, most surfaces and cloud types have an emissivity close to 1, with a notable exception being thin cirrus. Therefore, the brightness temperature sensed by the satellite is close to actual surface skin or cloud top temperature for scenes other than thin cirrus.
Infrared Channel (10.5-12.5 µm) » 24 Hour Loop Showing Surface Temperature Changes
The animations show diurnal changes in surface temperatures over land (cloudy areas versus cloud free areas). If they included a portion of cloud free ocean, changes in surface temperature would be evident over ____. Select the answer that completes the sentence.
The correct answer is C.
Diurnal changes are typically more evident over land than water because land has a low heat capacity whereas water has a high heat capacity.
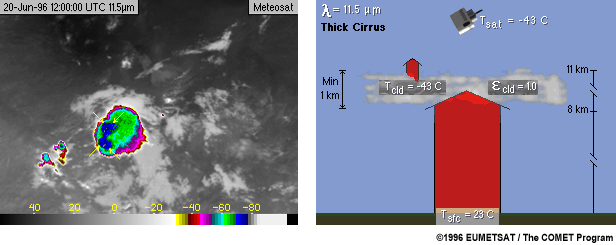
Infrared Channel (10.5-12.5 µm) » Thick Cirrus Emissivity
IR Image
VIS Image
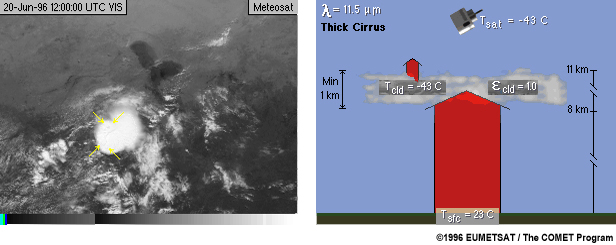
Thick cirrus clouds, such as those occurring above the core of a thunderstorm, are opaque to earth emitted infrared energy. Therefore the satellite senses only radiation emitted from cloud top. Since these clouds have an emissivity of almost 1 at 11.5 µm, the brightness temperature sensed by the 11.5 µm channel is a good indicator of the cloud top temperature.
The arrows indicate good locations for deriving approximate cloud top temperature.
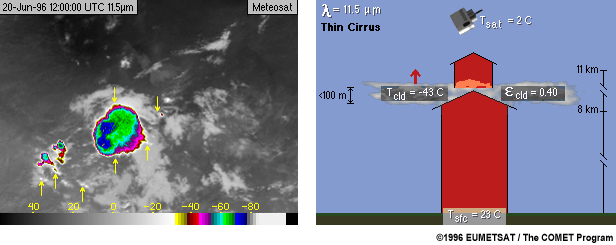
Infrared Channel (10.5-12.5 µm) » Thin Cirrus Emissivity
IR Image
VIS Image
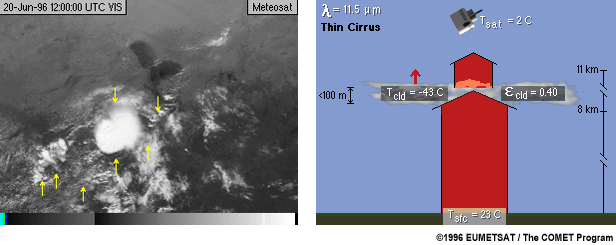
Thinner cirrus clouds are found upwind of a storm and along the anvil edge. These clouds all have emissivity less than 1. A portion of the energy from below passes through the cloud represented by the large red arrow, while the cloud also absorbs and emits energy represented by the small red arrow.
The arrows on the images indicate the locations of thin cirrus clouds which are less useful for deriving cloud top temperatures.
In the IR channel, thin cirrus clouds appear ______ their actual cloud top temperature. Select the phrase that completes the sentence.
The correct answer is A.
Thin cirrus clouds appear warmer because energy from lower layers passes through the cloud and is sensed by the satellite.
Infrared Channel (10.5-12.5 µm) »Thick Stratus/Fog Emissivity
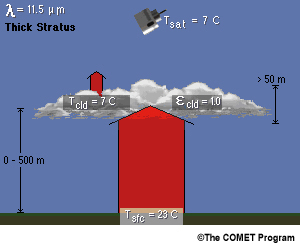
A typical stratus cloud or fog is opaque to earth emitted infrared energy, thus the satellite senses radiation emitted from cloud top. These clouds have an emissivity of almost 1 at 11.5 µm. Fog is depicted in the loop.
Can the brightness temperature sensed by the satellite be used to estimate cloud top temperature for thick stratus?
The correct answer is A.
The brightness temperature can be used to estimate cloud top temperature because the emissivity is close to 1.
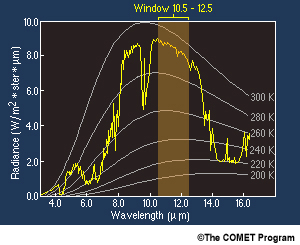
Infrared Channel (10.5-12.5 µm) » Noise Characteristics
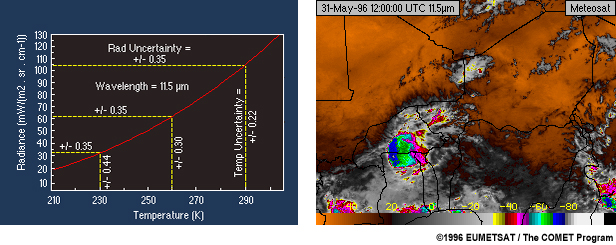
The graph on the left shows the blackbody radiance at 11.5 µm as a function of temperature. The sensitivity of the Meteosat 11.5 µm channel is plus or minus 0.35 radiance units. The associated temperature uncertainty increases with decreasing temperature. Here the temperature uncertainty is plus or minus 0.22 ° at 290 K and plus or minus 0.44 ° at 230 K. Looking at the image on the right, notice that details in both cold thunderstorm tops and the warm surface features appear noise free.
Infrared Channel (10.5-12.5 µm) » Spatial Resolution
IR Image
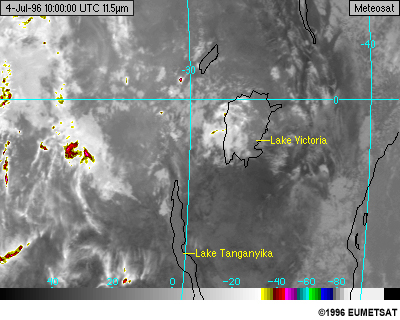
VIS Image
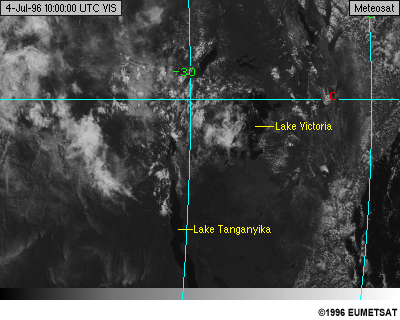
The Meteosat visible channel has a spatial resolution 2 times greater than the infrared window channel. In many cases, this increased resolution reveals that some infrared fields of view are only partially filled with clouds. This means that the sensed brightness temperature is somewhere between that of the cloud and the earth's surface. Several techniques have been developed to determine the clouds temperature. Those techniques use the measured brightness temperature from both the partially cloudy pixel and an adjacent clear pixel.
Infrared Channel (10.5-12.5 µm) »Skin Temperature Differences
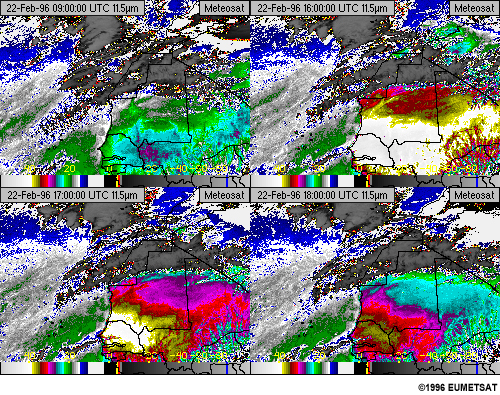
The diurnal temperature swing over the northwest part of Africa is evident in these images. The grey areas represent clouds, while the pink, green, and white areas represent surface temperatures.
Infrared Channel (10.5-12.5 µm) »Summary
Summary:
- Meteosat First Generation: 10.5 to 12.5 µm
- Meteosat First Generation: Sampled every 5 km east-west and south-north at nadir
- 0.22 °C temperature uncertainly at 290 K
- Little atmospheric attenuation
- Reveals surface and cloud temperatures
- Used for storm intensity and rainfall estimation
- Used for tracking cloud features in time to estimate atmospheric motion
- Optimal use may require enhancement
Water Vapour (5.7-7.1 µm)
Water Vapour (5.7-7.1 µm) » Introduction
The infrared water vapour channel is located between 5.7 and 7.1 µm where the earth's emitted spectrum is highly attenuated by water molecules. Thus, this channel senses radiation from water vapour in the mid and upper levels of the atmosphere.
Are mesoscale and hemispheric flow patterns revealed in water vapour imagery?
The correct answer is A.
Water vapour is transported by atmospheric circulations, so you can detect mesoscale features and hemispheric patterns within this channel.
Water Vapour (5.7-7.1 µm) » Noise Characteristics
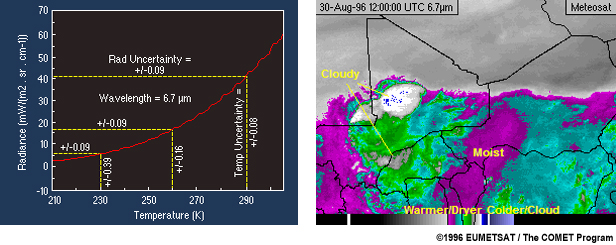
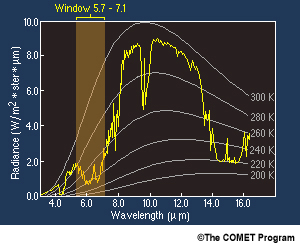
This channel on Meteosat is characterised by high radiometric sensitivity and low noise. The colour bar on the bottom of the image extends from warm and/or dry on the left to cold and/or cloudy on the right. In this image, dry areas are dark; brighter shades of grey depict increasingly moist areas, while cirrus clouds and thunderstorm tops are coloured.
Close inspection of the image reveals moist and cloudy areas and nearly noise free imagery. This channel can be used for feature tracking in cloud free air as well as monitoring thunderstorm cloud top temperatures.
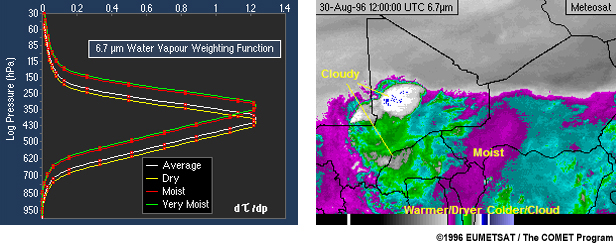
Water Vapour (5.7-7.1 µm) » Water Vapour Weighting Function
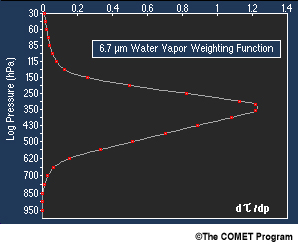
The graph on the left shows a weighting function for the water vapour channel in a standard atmosphere. Most of the energy that the satellite detects in this channel originates from a layer that extends from 500 to 200 hPa. The brightness temperature that is sensed can be thought of as a weighted mean value over this pressure range.
Water Vapour (5.7-7.1 µm) » Water Vapour Weighting Function Variability
Water vapour amounts are highly variable in both the horizontal and vertical throughout the troposphere, and the water vapour channel is very sensitive to the middle and upper troposphere.
Since the water vapour channel is sensitive to the upper 3 millimetres of moisture in the atmospheric column, the weighting function represents the layer in which that amount of moisture is located.
As moisture increases in the upper half of the atmosphere, the weighting function lifts about 100 hPa, indicating that contributions to the detected radiance originate from a higher layer of the atmosphere.
Note that there is negligible contribution from the surface and lower atmosphere.
Water Vapour (5.7-7.1 µm) » Vertical Cross-Section 1
Temperature/Mixing Ratio
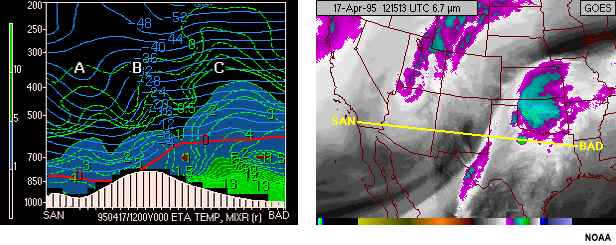
Temperature/Relative Humidity
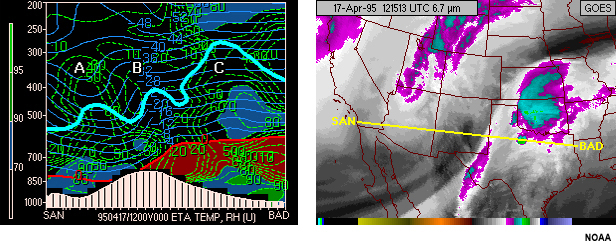
Vertical profiles of moisture and temperature are useful when assessing the three dimensional structure of various features as seen in 6.7 µm imagery. This example shows a water vapour image on the right with vertical cross-sections, one of temperature and mixing ratio and the other of temperature and humidity on the left. A line representing the coverage of the vertical cross sections is drawn on the image and extends from San Diego, California (SAN) to Shreveport, Louisiana (BAD), United States.
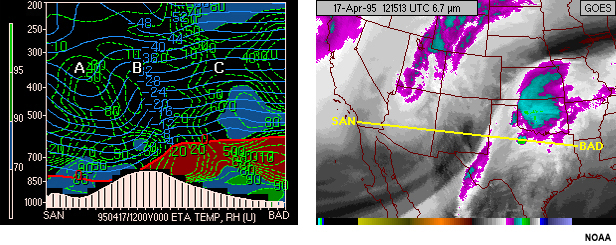
Water Vapour (5.7-7.1 µm) » Vertical Cross-Section 2
Temperature/Mixing Ratio
Temperature/Relative Humidity
Notice that in region A of the cross-section, colder air and higher moisture values above the 500 hPa level found within the base of a vigorous shortwave combine to produce lower radiance values and a brighter appearance in the image. At location B of the cross-section, notice the presence of somewhat dryer and warmer air associated with subsidence and advection processes along a strong north to south baroclinic zone. Here the 6.7 µm channel detects energy from a somewhat lower and warmer layer in the atmosphere than to the west, resulting in a darkening of the image. Relative humidity in excess of 80%, between 200 and 250 hPa across region C, indicate that the 6.7 µm channel may be detecting radiances originating from that layer.
Examine more closely the cross section of temperature and mixing ratio. Satellite brightness temperatures across region C closely resemble the 200 to 300 hPa layer mean temperatures. Sufficient moisture is present for the 6.7 µm channel to sense energy from that layer.
Water Vapour (5.7-7.1 µm) » Vertical Cross-Section 3
Temperature/Mixing Ratio
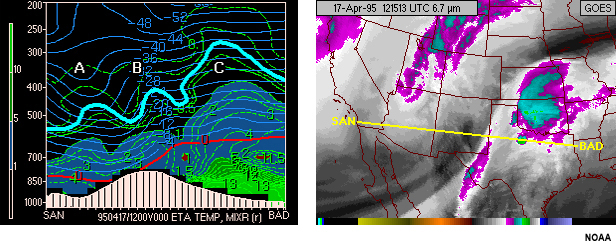
Temperature/Relative Humidity
Now a thick contour has been added to each vertical cross section to provide a better sense of the so-called water vapour topography as seen with the 6.7 µm channel. This contour represents a level where the vertically integrated moisture content is such that the 6.7 µm channel can sense no deeper into the atmosphere.
Water Vapour (5.7-7.1 µm) » Feature Detection Using Animation
Since water vapour amounts are highly variable in both the horizontal and vertical throughout the middle and upper troposphere, the water vapour channel is very useful for detecting both small and large scale atmospheric features.
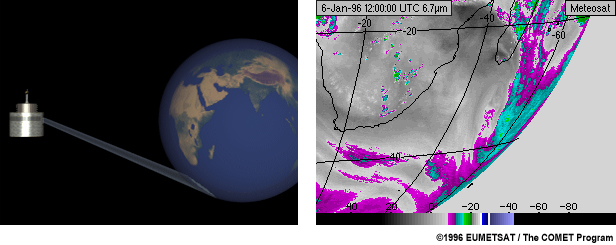
In this animation, the movement of an upper level trough off the tip of South Africa is readily detected. Ahead of the trough, increasing development indicates high level subtropical moisture and strong vertical motion.
The dark/orange areas indicate the presence of jet streaks. In this loop, a jet streak is rotating around the base of the trough with the vortex becoming less organised as time progresses. Individual eddies within the vortex become apparent, and the trough becomes negatively tilted and begins to be influenced by a short wave to the west.
Water Vapour (5.7-7.1 µm) » Storm Relative Loop
Often it is useful to animate water vapour imagery relative to an atmospheric feature of interest. In this animation, the trough near the tip of South Africa is held stationary allowing the relative flow to be analysed. Therefore, you can determine if a weather system is accelerating or de-accelerating. The trough is accelerating near the end of the loop.
This type of animation allows for identification of smaller scale features in this cut off low pressure system.
Water Vapour (5.7-7.1 µm) » Limb Darkening 1
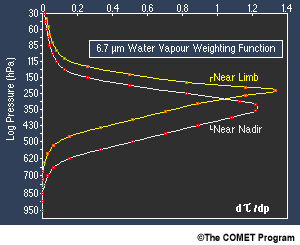
As the satellite scans farther away from nadir the scan angle increases, and water vapour channel radiances originate from higher in the atmosphere. In the left panel, the highlighted weighting function is typical for near nadir viewing. When viewing closer to the limb, energy detected by the satellite comes from water vapour higher in the atmosphere. Notice the increase in path length in the animation. The weighting function for near the earths limb shows that the layer contributing to the detected energy is relatively thin and from higher in the troposphere. Little energy from the warmer atmosphere below is sensed. This phenomenon, known as limb darkening, is particularly noticeable for scan angles greater than 60 degrees.
Water Vapour (5.7-7.1 µm) » Limb Darkening 2
In the water vapour image on the right, notice that brightness temperatures become progressively colder toward the edge the disk once the scan angle is greater than 60 degrees local zenith angle.
Water Vapour (5.7-7.1 µm) »Summary
Summary:
- Meteosat First Generation: 5.7 to 7.1 µm
- Meteosat First Generation: Sampled every 5 km every east-west and south-north at sub-satellite point
- 0.08 °C temperature uncertainty at 290 K
- Very sensitive to moisture
- Shows variations in upper tropospheric moisture
- Typically senses upper half of troposphere; higher in moist and lower in dry regions
- Atmospheric wave structures are very apparent; short waves readily seen
- Tracking features in sequences of water vapour images useful for inferring atmospheric motion (particularly moisture)
- Demonstrates limb darkening
- Optimal use may require enhancement
Cloud Type Table
Cloud Type Table »Cloud Type Table
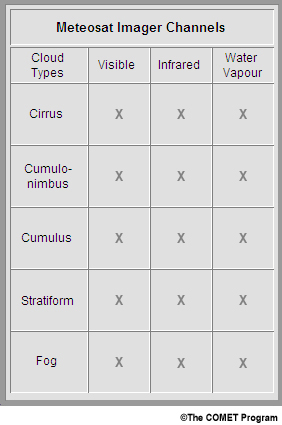
Review how the cloud types are displayed in the different channels by clicking on each cell in the table. When you are ready, answer the questions by clicking on the question tabs below.
Question 1
Which of the following channels can be used to estimate cloud top height?
The correct answers are A and C.
Since most surfaces and cloud types have an emissivity close to 1 in the longwave infrared, brightness temperature is approximately equal to cloud top temperature. Thus, cloud top height can be estimated with the 11.5 mm IR channel. For visible, cloud top height can be inferred via cloud shadow geometry. The water vapour channel can not be used (except for thick cirrus) because it detects radiation from a layer.
Click the Question 2 tab to proceed.
Question 2
Which of these cloud types can be observed in the water vapour channel? Click on ALL choices that apply.
The correct answers are C and D.
These cloud types occur at levels detectable by the water vapour channel. Low stratus and cumulus humilis are at too low a level in the atmosphere to be detected.
Click the Question 3 tab to proceed.
Question 3
Which of these cloud types can be viewed in the visible channel? Click on ALL choices that apply.
The correct answers are A, B, C, D and E.
In general, all these cloud types are detectable in the visible channel if the resolution allows it and the cirrus is not too thin.
Click the Question 4 tab to proceed.
Question 4
In the water vapour channel, the temperature of thin cirrus is _____ the brightness temperature in the IR channel. Select the phrase that completes the sentence.
The correct answer is A.
In the water vapour channel, thin cirrus is colder because it is not affected by as much radiation from below the cirrus cloud level.
Click the Question 5 tab to proceed.
Question 5
What is the smallest distinguishable feature that can be seen in the Meteosat visible channel?
The correct answer is B.
The resolution area of the Meteosat visible channel is 2.5 by 2.5 km at sub-satellite point.
Click the Question 6 tab to proceed.
Question 6
Do sub-pixel objects contribute to the pixel value?
The correct answer is A.
All features within the field of view of the sensor contribute to the pixel value.
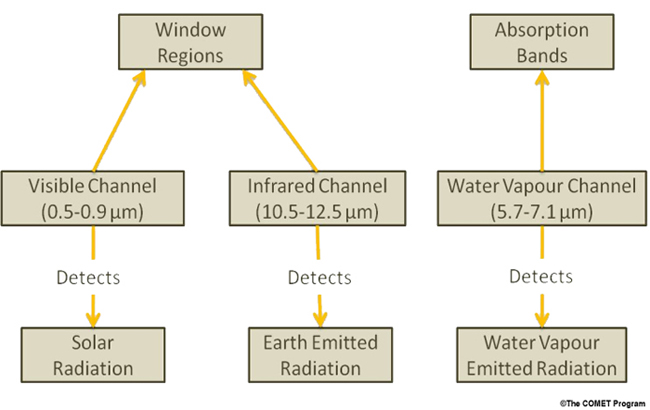
Concept Map
Concept Map »Concept Map
Click on any topic for more information. The information will either appear in a pop-up box or you will be taken to another page (in which case you should click the Back button to return to this page).
Congratulations! You have completed the lesson. Please take the quiz and fill out the survey.