
Introduction
Table of Contents
Background
Background »Introduction
Weather forecasts are critical to a wide range of user groups, in particular, farmers, pilots, industry, and the general public. Satellite observations are essential to generating accurate and timely forecasts in that they provide wide area coverage and frequent observations, and track moisture transport at mid and high levels in the atmosphere.
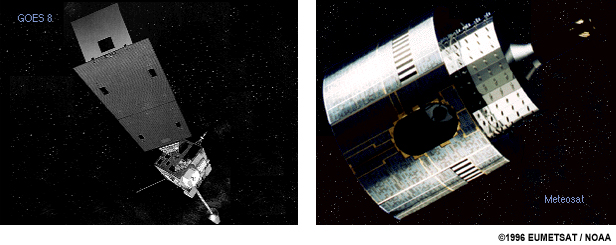
This lesson presents the scientific and technical basis for using visible and infrared satellite imagery so forecasters can make optimal use of it for observing and forecasting the behaviour of the atmosphere. The concepts and capabilities presented are common to most international geostationary (GEO) and low-Earth orbiting (LEO) meteorological satellites since their inception, and continue to apply to both current and newer satellite constellations. Most of the imagery in the lesson comes from the first generation Meteosat geostationary satellites of which Meteosat-7 still provides coverage from its vantage point over the Indian Ocean. This lesson is an adaptation of a GOES lesson developed in 1995 so some imagery from the GOES-8 and -9 satellites flown between 1994 and 2005 is included as well.
The lesson reviews remote sensing and radiative transfer theory through a series of conceptual models. The discussions contain explanations of the Meteosat First Generation imager channels (visible, infrared, and water vapour) and the phenomena that they can monitor individually and in combination.
Background »Lesson Uses, Goals, and History
This lesson has been designed to be used in multiple ways:
- As a self-paced learning program for forecasters and satellite data users
- As a teaching tool in courses on satellite meteorology at regional meteorological training centres and in university programs
- As a reference tool for forecasters and students
The goals of the lesson are to:
- Introduce the Meteosat imager channels
- Explain the concept of radiation and describe the relationship between radiance and reflected solar and earth-emitted energy
- Describe reflected solar and terrestrial radiation as they relate to satellite observations. Explain how that energy is selectively absorbed, reflected, and scattered by atmospheric constituents
- Explain the processes of radiative transfer
- Explain selective absorption through the atmosphere
- Describe and provide practice in the applications of the Meteosat imager channels
This lesson has an interesting history. In 1995, COMET published a basic remote sensing lesson on CD-ROM that focused on GOES satellites. In 1997, the lesson was adapted for an African audience as part of the ASMET (African Satellite Meteorology Education and Training) project, and published on CD-ROM. Most of the GOES imagery was converted to Meteosat imagery over Africa. This new version makes that content available online so users can access it more easily. Note that the initial conversion to HTML was done courtesy of EUMETSAT.
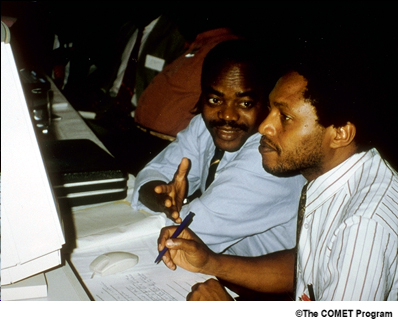
For those unfamiliar with the ASMET project, it produces online and CD-based learning lessons that teach African forecasters how to enhance their forecasts by making better use of meteorological satellite images and products. The lessons are produced by the ASMET team, which consists of meteorology instructors from the South African Weather Service (Pretoria) and the Regional Training Centers in Kenya (KMD/IMTR) and Niger (EAMAC) under the guidance of EUMETSAT (Germany) and COMET/UCAR (USA). ASMET is funded by EUMETSAT. For more information, see the ASMET website at http://www.meted.ucar.edu/communities/asmet/.
Background »About Meteosat Satellites
Meteosat is a geostationary satellite flown as part of the Meteosat First Generation constellation beginning in 1997. The last Meteosat, Meteosat-7, was launched in September 1997 and is still operational in the Indian Ocean.
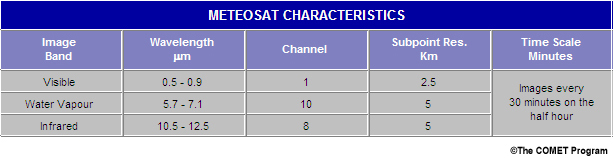
The chart shows Meteosat's spectral channels, maximum resolution at the sub-satellite point, and the imaging frequency.
Meteosat produces 8-bit imaging data, whereas the Meteosat Second Generation satellite series has additional visible, short- and long-wave infrared channels that produce 10-bit data sampled at higher spatial resolution and every 15 minutes instead of 30 minutes.
For further information on both Meteosat First Generation (MFG) and Meteosat Second Generation (MSG) satellites, visit the EUMETSAT web site at www.eumetsat.int.
Imagery Enhancements
Imagery Enhancements »Definition

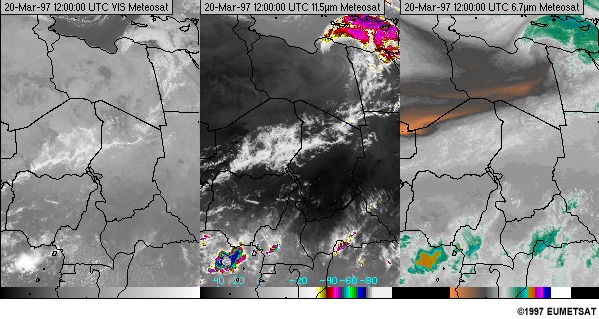
Throughout this lesson, you will see satellite imagery that has been manipulated (enhanced) to highlight particular weather features. This section introduces enhancements typically used on visible, infrared, and water vapour imagery.
In the enhancement process of infrared imagery, shades of grey representing temperature values in the original imagery are assigned non-grey colour values. In the example displayed, enhancements are added to highlight thunderstorm cloud tops in the IR and water vapour imagery (purple to green in the IR image, and green to purple in the water vapour image). You should always study the colour bars on enhanced imagery to determine which temperature ranges are being highlighted.
Imagery Enhancements » Visible Enhancement
Visible imagery provides information over a useful dynamic range that extends far beyond the eyes ability to discriminate. Enhancements are used to increase contrast so features are more apparent.
Different enhancements for low light situations versus bright cloud-filled scenes at mid-day allow details to be detected that would go unnoticed with one standard enhancement.
The loop shows an image with different enhancements. Notice how the updraft portion of the thunderstorm and induced gravity waves become more apparent near the end of the loop where the enhancement is high.
Select the tabs for more information on low, medium, and high enhancements for visible imagery.
Low Visible Enhancement
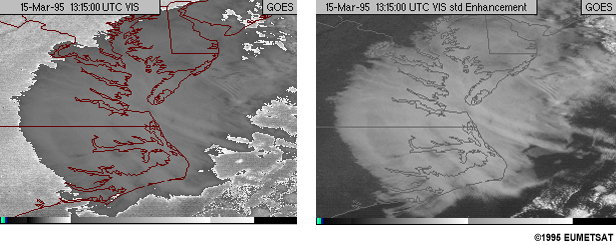
Low enhancements provide better definition of dark areas. Notice how clearly land features and coastlines are depicted when the dark end of the brightness range is enhanced.
Medium Visible Enhamcement
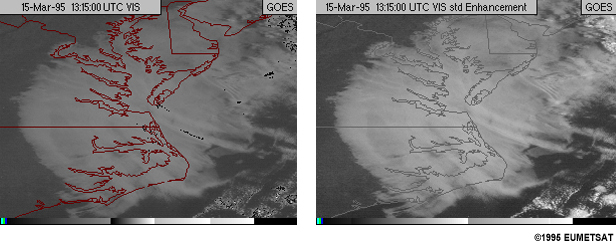
Medium enhancements provide better definition in the middle grey scales. As the mid-ranges are enhanced, contrast between cloud and ground becomes very distinct and some details begin to appear in the cloud field.
High Visible Enhamcement
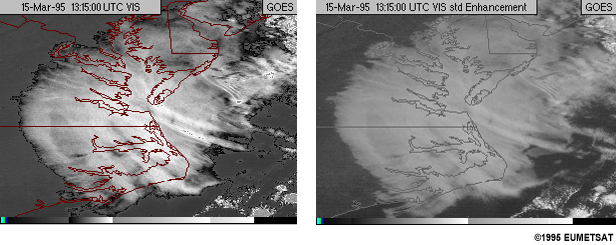
Enhancing bright regions shows great detail in cloud structure. Also, in areas of stable clouds such as fog and stratus, differences in brightness may be related to cloud density and thickness.
Imagery Enhancements » Infrared Enhancement
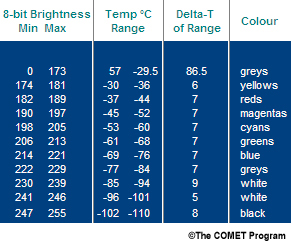
Enhancement curves are often applied to IR imagery to highlight tops of thunderstorms. The table below displays brightness temperatures, temperature ranges, and corresponding colours for enhancements. Click on the Count Values tab to see the count values (blue, green, and red values) for each enhanced colour.
Levels of enhancement do not occur until -30.0 °C or colder, at which temperatures thunderstorm anvils usually exist. Warmer temperatures are not colour enhanced and appear as grey shades.
Enhancement
Count Values
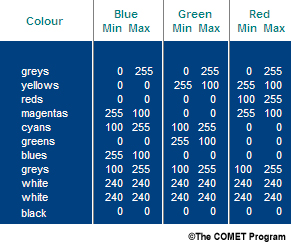
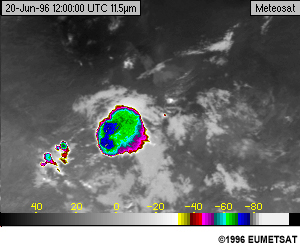
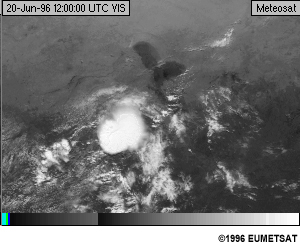
Using the table, the IR image is enhanced to better delineate structure of thunderstorm cloud tops. Use the tab to see the same storm in visible imagery.
IR Image
VIS Image
Imagery Enhancements » Water Vapour Enhancement
Enhancements are added to water vapour imagery to highlight warmer and/or dryer regions from colder and/or cloudy regions.
Enhancements as seen here also serve to enhance details within observed circulation features.