Selective Absorption
Table of Contents
Selective Absorption
Selective Absorption »Introduction
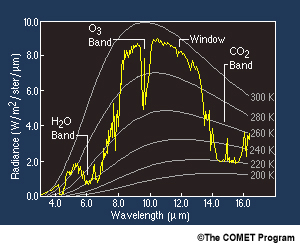
In this section, the different spectral absorption bands in the infrared region of the earth's emitted spectrum will be examined. In the left panel, the jagged plot shows the earth emitted radiation received by a satellite at the wavelengths shown on the x-axis. The smooth lines represent the Planck emission curves for various temperatures. The figure on the right shows some of the atmospheric components that cause the absorption in the earth's emitted radiation detected by the satellite.
Selective Absorption »Water Vapour Absorption Band
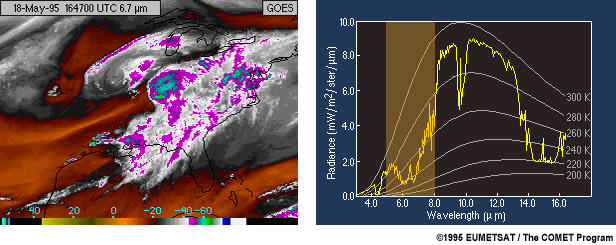
Water vapour blocks almost all upwelling radiation from the lower atmosphere between 5 and 8 µm.
Can altocumulus below thick cirrus be seen on the water vapour channel?
The correct answer is B.
Thick cirrus blocks radiation coming from the lower atmosphere.
Selective Absorption »Long Wave Infrared Window Band
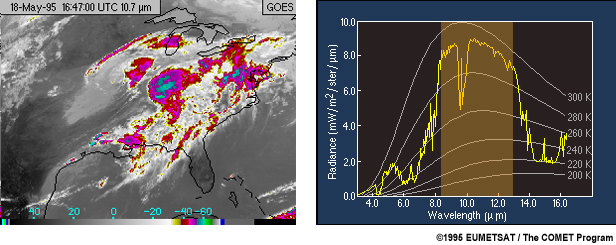
In the atmospheric window, there is very little attenuation by gases. Hence, energy from the surface dominates the radiance reaching the top of the atmosphere. There are two areas within this window that experience significant attenuation. They are the low level water vapour band near 12.5 µm, and the ozone band near 9.7 µm. Comparable channels are available on the Meteosat Second Generation satellite series.
Selective Absorption »Ozone Absorption Band
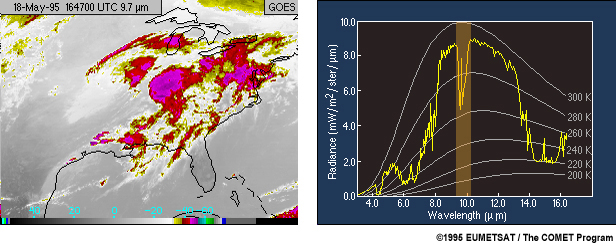
The atmospheric window includes an area with strong absorption due to ozone. In the centre of this band, a small upward spike indicates atmospheric warming above the tropopause.
Note that this channel is available on the Meteosat Second Generation (but not First Generation) series of satellites.
Selective Absorption »Low Level Water Vapour Absorption Band
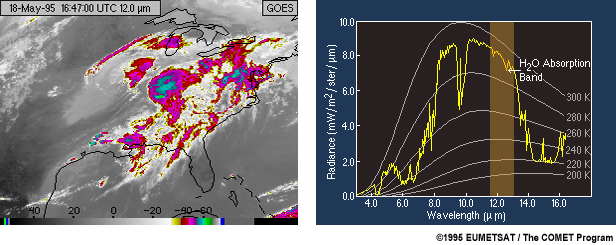
A low level water vapour absorption band is centred at 12.5 µm, between the carbon dioxide absorption band (around 15 µm) and the atmospheric window (centred at 10.7 µm). The reduction of upwelling radiance in this region is caused by water vapour in the lower troposphere.
Selective Absorption »Carbon Dioxide Absorption Band
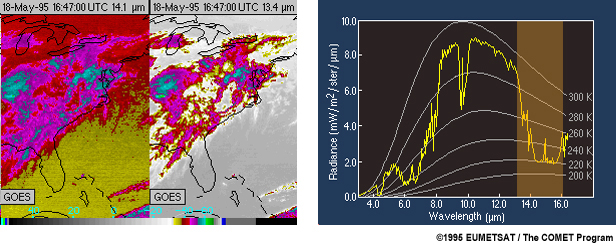
In the carbon dioxide absorption band, a negligible amount of energy from the earth's surface reaches the top of the atmosphere. Closer to the centre of the absorption band, upwelling radiance corresponds to very cold temperatures, indicating that the energy is being emitted from higher in the troposphere. The spike in the centre of the absorption band is caused by the atmospheres warming with height above the tropopause. Along the edges of the absorption band, brightness temperature increases as absorption decreases and radiation from lower in the atmosphere reaches the satellite. Generally, spectral channels in the CO2 absorption band are used for measuring the change of atmospheric temperature with height.
Selective Absorption »Summary
Summary:
- Infrared radiation from the Earth surface and atmosphere, detected by the satellite sensor, varies as a function of wavelength
- Atmospheric CO2, H2O, and O3 cause absorption bands in the Planck emission curves
- One atmospheric window, where minimal absorption occurs, is between 8 and 13 µm
- O3 has an absorption band at 9.7 µm, H2O has one at 6.7 mm and another at 12.5 µm, and CO2 has one at 15.0 µm and another at 4.5 µm
- Spectral channels in different parts of the CO2 absorption band are used for measuring the change of atmospheric temperature with height (known as sounding)
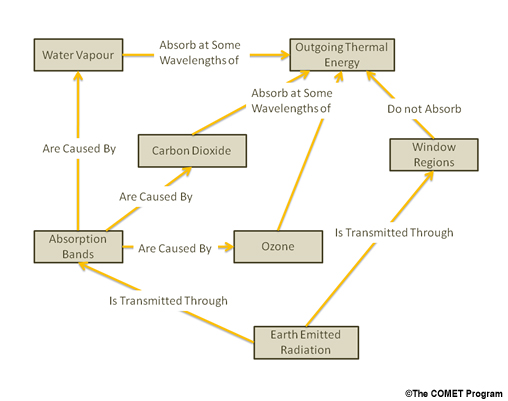
Concept Map
Concept Map »Concept Map
Review the concept map for this section. You can get more information about each topic by clicking on its box. (The information will either display in a pop-up box, or you will be sent to another page in this section; click the Back button to return to this page.)
Absorption bands are wavelength intervals where thermal radiation is absorbed and does not reach the satellite.