Early Stage Convection
This case from 20 March 2016 lets you practice identifying deep convection using satellite imagery and derived products. Visible, infrared, convection RGB, and airmass RGB products are particularly useful for monitoring convection. Instability products and quantitative precipitation estimates are also helpful.
View the animations on 20 March 2016 from 03 to 09 UTC, looking for areas of convection. Then answer the questions below. Note that in the severe convection RGB, strong updrafts in severe convective storms that produce small ice particles at cloud tops are bright yellow, while weaker updrafts with larger ice particles at cloud tops are red or dark red.
Question 1
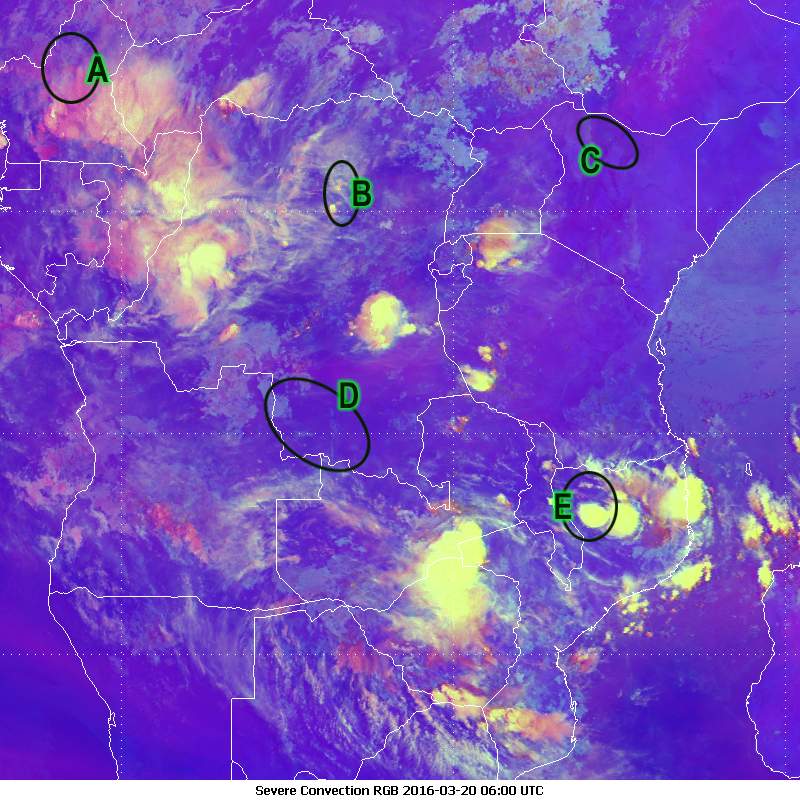
Which areas have an early phase of convection at 0600 UTC? Select all that apply.
The correct answers are B and E.
In areas B and E, intense updrafts are evident in the yellow colours in the convection RGB. The enhanced IR imagery shows cloud tops cooling rapidly. The convection at E is advancing rapidly, and about to turn into an advanced stage of convection.
Area A mostly consists of clouds associated with developing convection late at night until 04 UTC. The convection is less intense at 06 UTC, as indicated by the reddish colours in the convection RGB and the relatively warm cloud top temperatures in the enhanced IR images.
Areas C and D do not yet have signs of early convection at 06 UTC.
Question 2
What information helped you identify the areas of early convection in each product?
The correct answers are A, D, E, and H.
In IR 10.8 µm imagery, the white cells indicate rapidly developing high level cold clouds (CBs). In contrast, the grey and dark grey cloud sheets mostly represent low- or middle-level non-convective cloud areas.
In enhanced IR imagery, CB clouds with the largest vertical extension have the coldest cloud top temperatures, well below -50 degrees C. In contrast, the non-convective low- and middle-level clouds have temperatures near 0 degrees C.
In the HRV imagery, the very bright areas indicate early convection. There are no shadows from overshooting tops in the cloud layer, which typically indicate well-developed deep convection. In contrast, the non-convective cloud areas are grey and have a relatively smooth texture.
In the severe convection RGB, developing bright yellow areas indicate strong updrafts that lift small ice particles to the top layers of the cloud. In contrast, reddish colours indicate Cb clouds that are developing more slowly. In the animation, we see bright yellow cells that are developing rapidly over a short period of time.