Contributions From Other Products
Question
The images in the tabs above provide useful information for identifying the ITCZ. Examine them, then decide what information each image contributes to identifying the ITCZ. Select all of the options that apply.
The correct answers are A, D, F, and G.
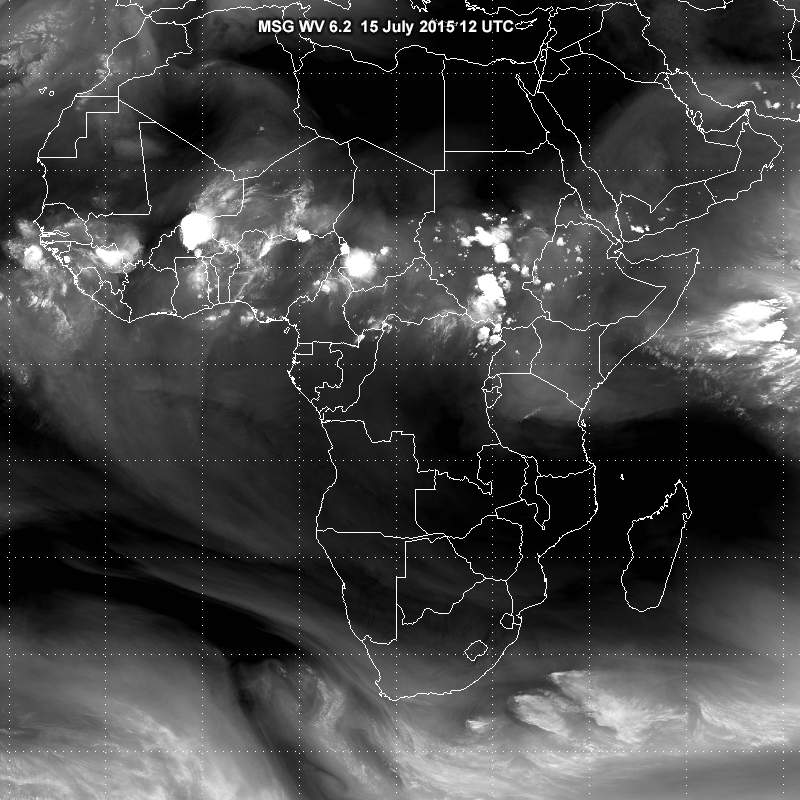
WV 6.2 shows the moisture content of the middle and upper troposphere, but not the lower troposphere. This makes it useful for monitoring upper-level flow and moisture distribution across the ITCZ.
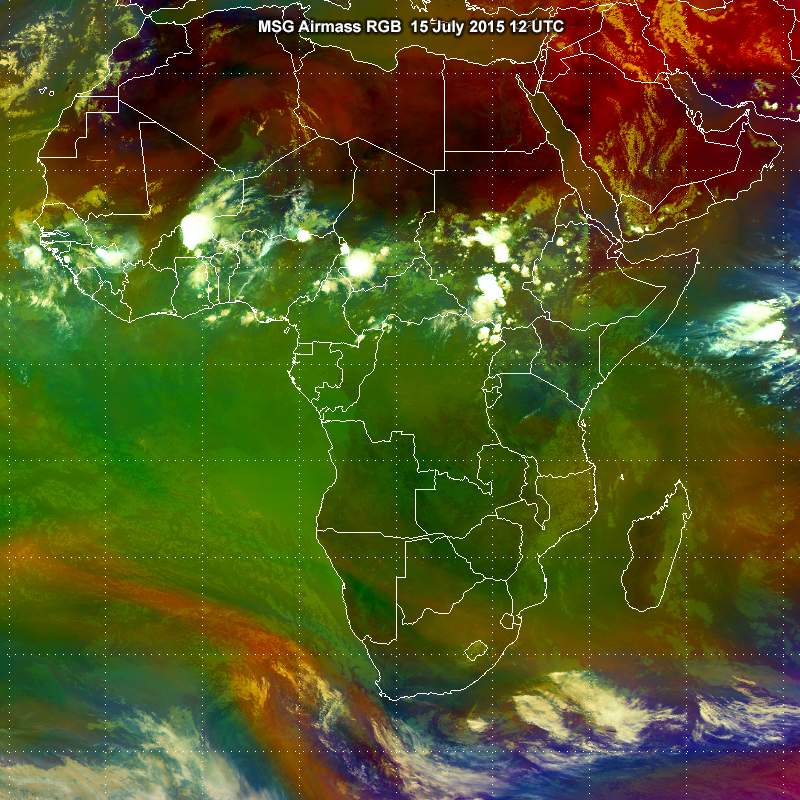
The airmass RGB shows different airmasses very clearly. In the image, the very dry airmass over the Sahara is apparent in reddish colours, while the hot, humid tropical airmass is green. The product shows convective clouds, but it cannot be used to directly measure atmospheric instability.
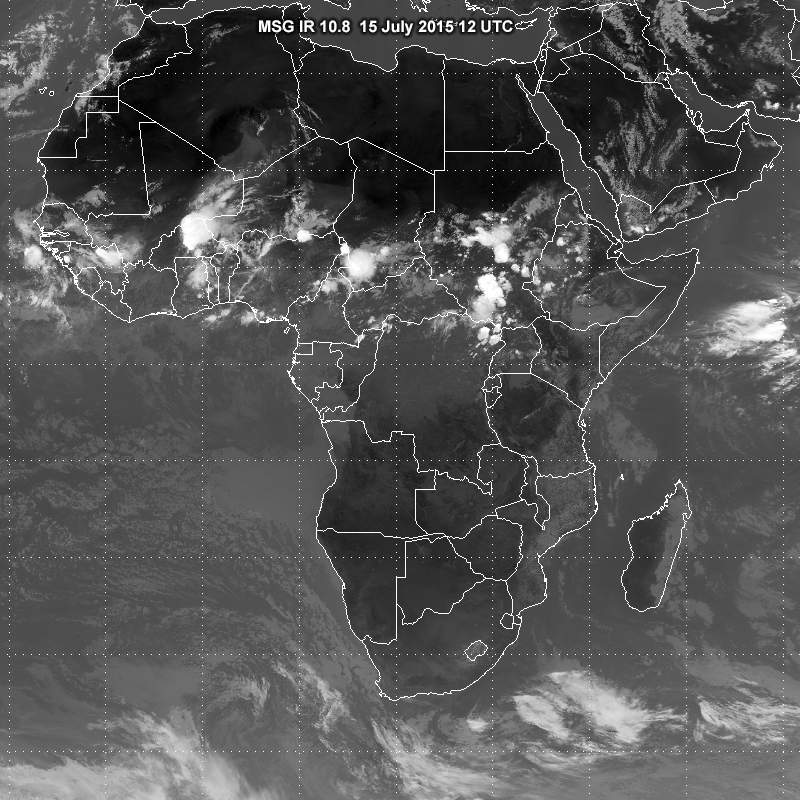
IR 10.8 gives an overview of the location of clouds, the temperature of the cloud-free surface, and cloud top temperatures. But it does not help find confluent areas of surface winds.
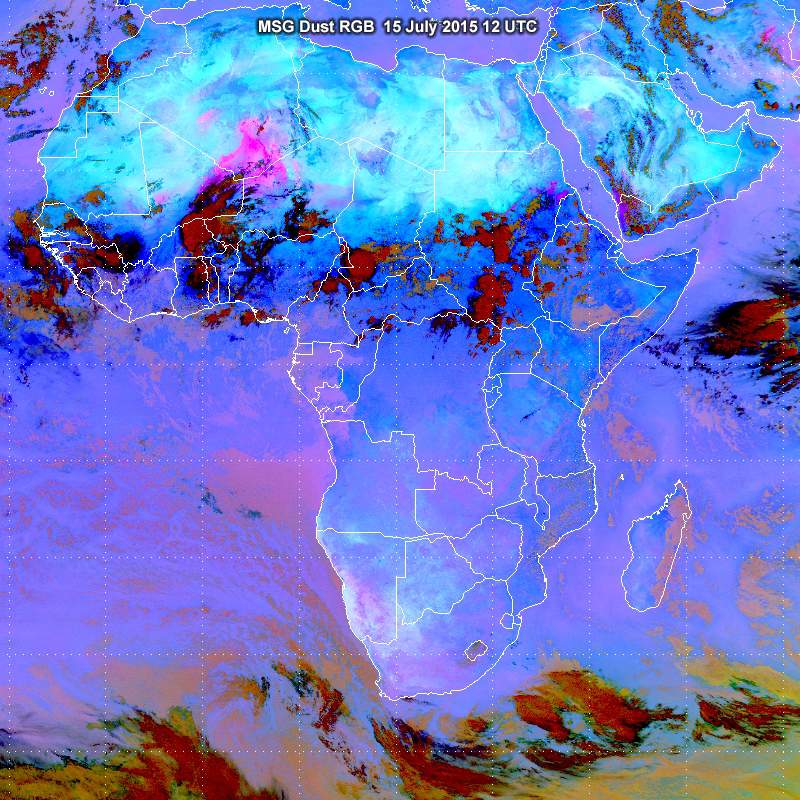
The dust RGB is a very useful for monitoring low-level humidity. Humid areas are deep blue while dry areas are light blue or cyan. But it does not provide direct information about low-level convergence. However, in our example, it does show how the surface cyclonic circulation lifts dust over north Niger and south Algeria.