 JI
and
COMMA
CO
).
JI
and
COMMA
CO
).
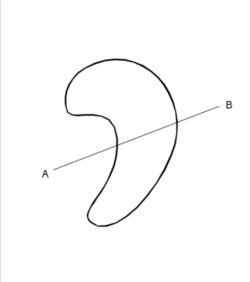
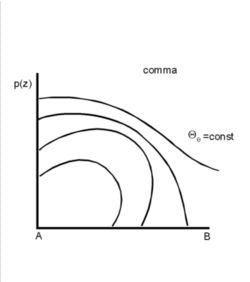
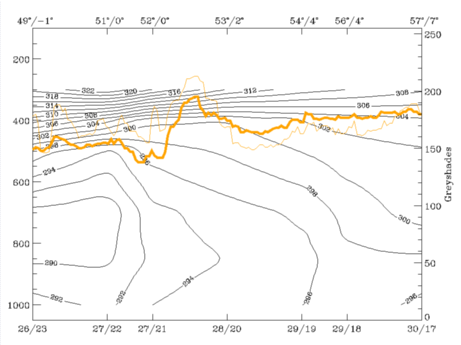
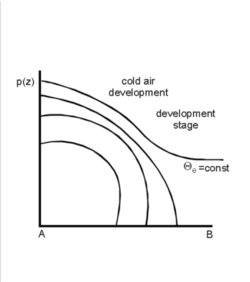
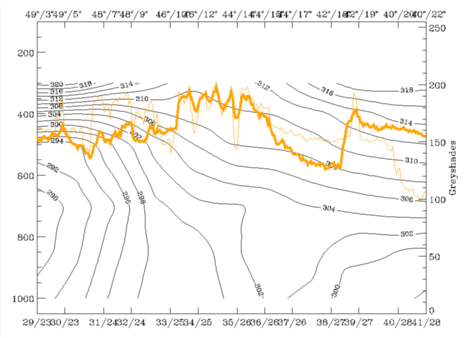
The isentropes of the equivalent potential temperature reveal two features:
In the area of the baroclinic boundary an intensification of humidity in the middle and upper levels should be noticed. In the mature stage the relative humidity has high values (about 60 to 80%) in front of and above the frontal zone. Low values of about 30% can be found behind and below the crowding zone of the cold air development.
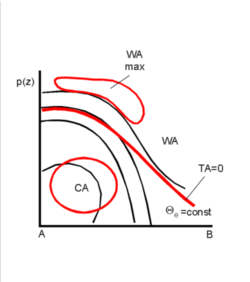
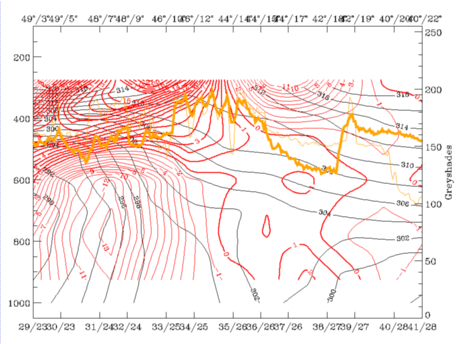
The field of temperature advection is characterized by CA within the area of cold air development. If there is some WA in front of the cold air development it can be found at middle and high levels. Within the upper most levels of the troposphere pronounced WA can be observed, which is related to the tropopause.
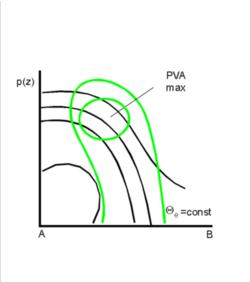
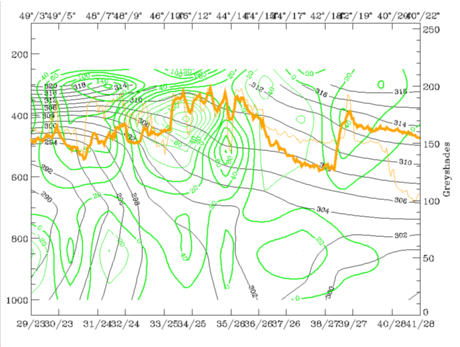
The whole area of cold air development is characterized by PVA. As usual
the values of the PVA generally are increasing with height
(compare also chapter FRONT INTENSIFICATION BY JET CROSSING
JI
and
COMMA
CO
).
The fields of divergence and omega do not show any specific features: there is upward motion in connection with the cloud configuration mostly caused by increase of PVA with height. Circulation cells of divergence and omega, which are distinct features of fronts, cannot be found in the cold air development.
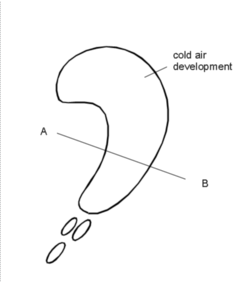
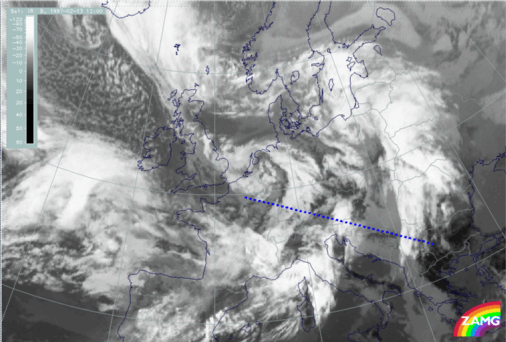
The pixels of the IR, WV and VIS images show high values. In the cross section
line across the baroclinic boundary they are somewhat lower in the initial stage
and characterized by a lot of local peaks indicating the cellular structure of
the cloud spiral
(compare
cloud structure in satellite image
and
meteorological physical background).
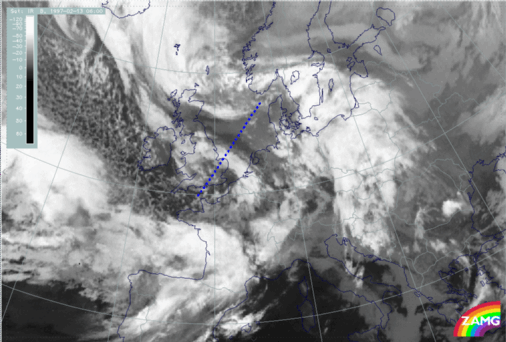
13 February 1997/06 UTC - IR image; lines: dashed blue: position of vertical
cross section
|
|
13 February 1997/06 UTC - vertical cross section; lines: black: isentropes of
the equivalent potential temperature
|
|
13 February 1997/12 UTC - IR image; lines: dashed blue: position of vertical
cross section
|
|
13 February 1997/12 UTC - vertical cross section; lines: black: isentropes of
the equivalent potential temperature
|
|
13 February 1997/18 UTC - IR image; lines: dashed blue: position of vertical
cross section
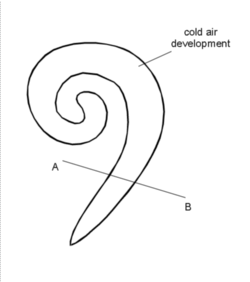
|
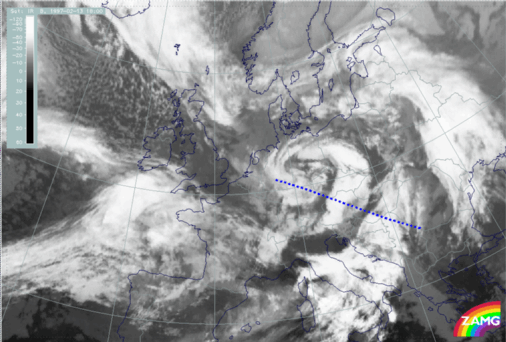
|
13 February 1997/18 UTC - vertical cross section; lines: black: isentropes of
the equivalent potential temperature
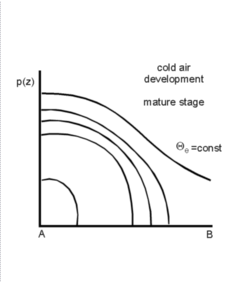
|
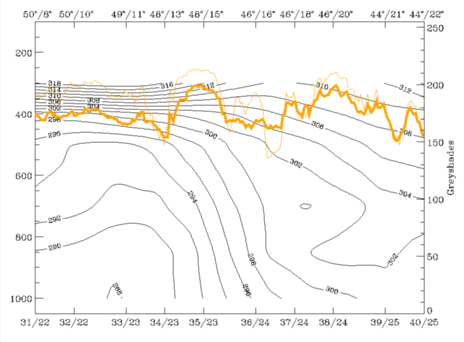
|
13 February 1997/12 UTC - vertical cross section; lines: black: isentropes of
the equivalent potential temperature, red: temperature advection - WA (thick)
and CA (thin), orange: IR (thin) and WV (thick) signal
|
|
13 February 1997/12 UTC - vertical cross section; lines: black: isentropes of
the equivalent potential temperature, green: vorticity advection - PVA (thick)
and NVA (thin), orange: IR (thin) and WV (thick) signal
|
|
 HELP - I AM LOST
 MAIN MENU OF THE MANUAL
SUB-MENU OF THE COLD AIR DEVELOPMENT
MAIN MENU OF THE MANUAL
SUB-MENU OF THE COLD AIR DEVELOPMENT
 FOURTH SUB-CAHPTER - WEATHER EVENTS
 SIXTH SUB-CHAPTER - LEVELS IN SATREP, KEY PARAMETERS AND REFERENCES