 (The
material below is still being developed)
(The
material below is still being developed)
(The
material below is still being developed)
In this guide the basics of how to interpret the satellite imagery that is available from many sources are described. It starts reviewing how electromagnetic radiation is generated and how it interacts with the atmosphere. From there, the instruments with which the basic radiometric measurements are made on currently operational meteorological satellites are briefly described. Next, an introduction to satellite image interpretation is presented. The case examples used in this guide contain imagery from the United States Geostationary Environmental Satellite - 8 (GOES-8) and from NOAA-AVHRR polar orbiting satellites. However, most of the imagery interpretation and discussion are based only on satellite imagery depicting weather and surface conditions over South America. This guide is designed to help students and forecasters to interpret the satellite imagery available through small receiving stations and/or on Internet. The users can select the English or Spanish language clicking on the respective key.
Table of Contents
This guide is being developed by Velasco, I., Di Lorenzo,
N. L., Flores, A. L. and Nuñez, J. M., 1997-99.
For information, contact: Velasco, I or
Di Lorenzo, N. L.,
SAT-RAD Team (Satellite and Radar development products
Team)
Depto. Ciencias de la Atmósfera,
Universidad de Buenos Aires.
1428 Buenos Aires, Argentina
Phone/Fax: 54-11-4576-3356 or 3364
e-mail: velasco@at.fcen.uba.ar
Electro Magnetic Radiation (EMR) is the basis for all remote sensing systems.
Radiation is energy that is emitted in wave form by all substances that are not at absolute zero.
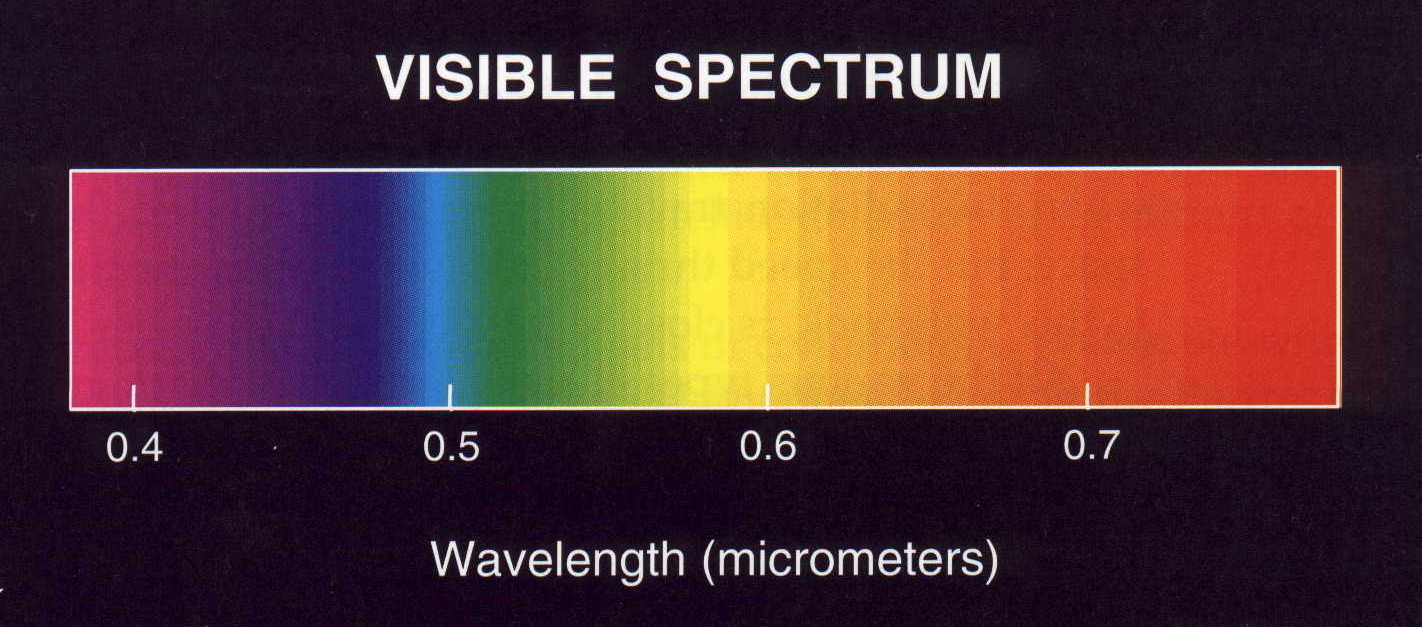
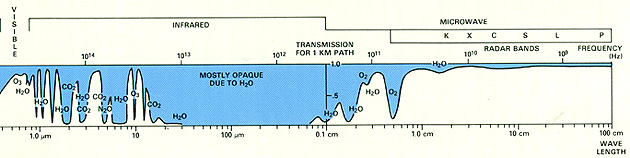
The electromagnetic spectrum is a continuum of all the types of electromagnetic radiation. On the spectrum, the EMR is generally ordered according to wavelength (l ) or frequency (n ). Figure 2.1 shows the electromagnetic spectrum, which is divided in regions. Figure 2.2 shows the visible spectrum. Objects radiate energy in specific ranges of wavelengths, often referred to as the object's spectrum.
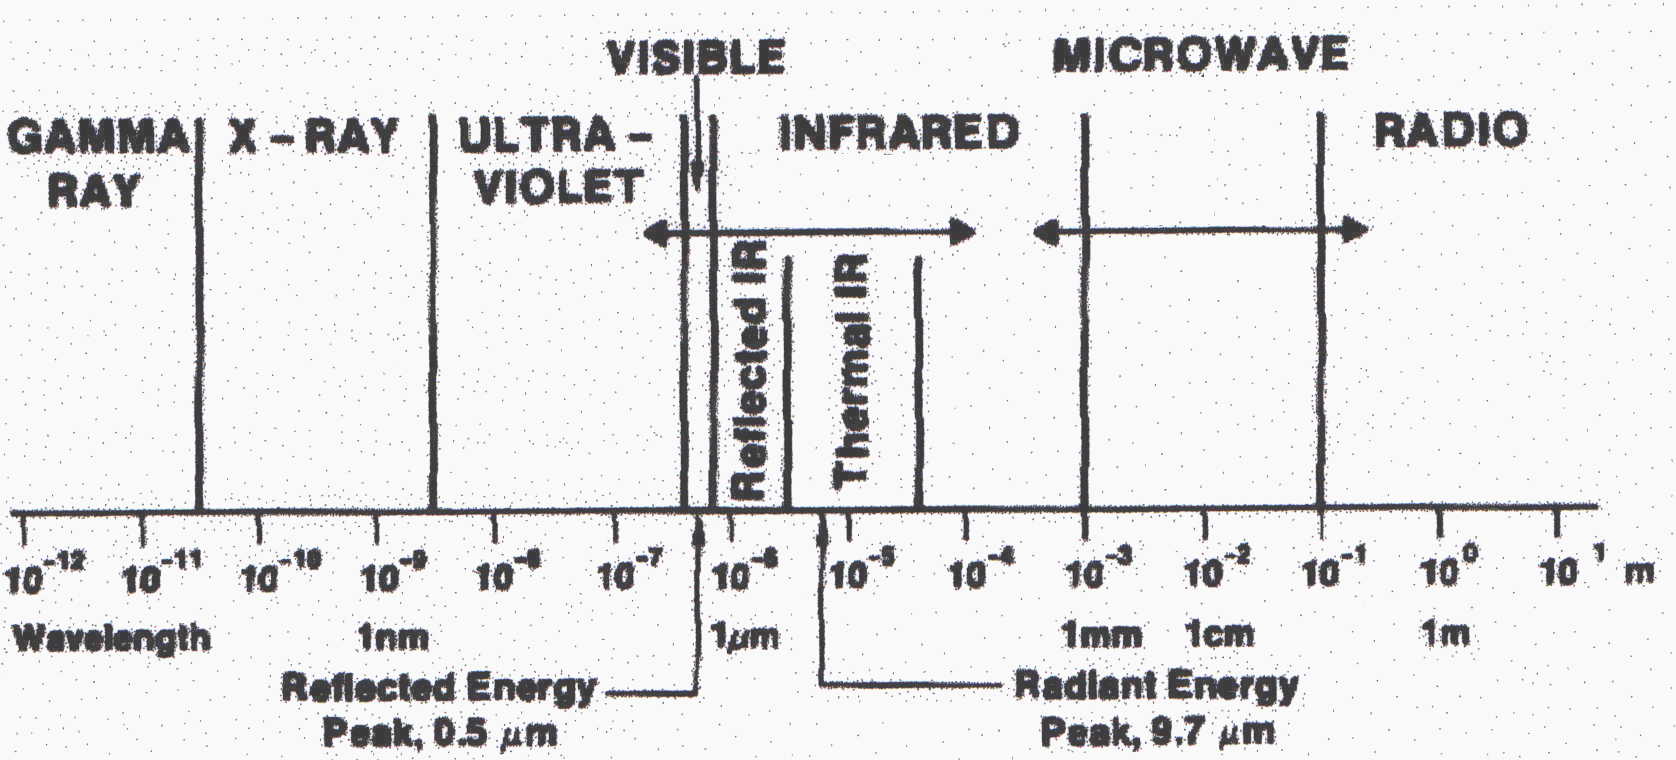
Figure 2.1. The electromagnetic spectrum showing
the wavelengths radiation types (regions)
Remote sensing systems operate in various portions of the spectrum: visible (VIS), infrared (IR) and microwave (MW).
The interaction of radiation with matter depends on:
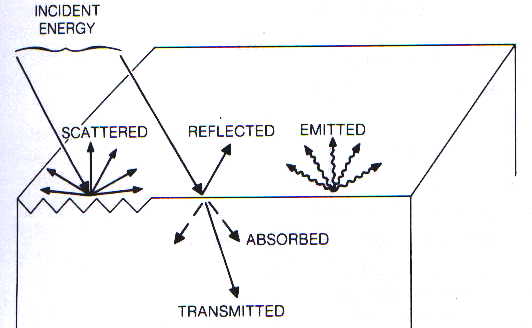
All satellite remote sensing systems involve the measurement of Electro Magnetic Radiation, which has been emitted, reflected or scattered by the atmosphere or the surface. These EMR measurements allow the determination of actual physical values of the atmosphere and the surface.
Targets such as land and sea at the surface and water droplets and ice crystals in the atmosphere, reflect, absorb, emit and transmit radiant energy over a wide range of wavelengths.
The emitted energy is described by a set of idealized blackbody radiation laws. The Plank function that describes blackbody radiation is given by:
 2.1
2.1
According to the Stefan-Boltzman law, the amount of energy
per unit area, E, emitted by a blackbody, which is independent of direction,
is given by:
The spectral distribution of blackbody radiation depends on temperature.
An object with very high surface temperature (i.e., the Sun), will emit
very high energy radiation at shorter wavelengths, while a cooler object
(i. e., the Earth) will emit a lower energy at longer wavelengths. The
Wien displacement law gives this relationship:
 2.3
2.3
| MATERIAL | TEMPERATURE (° C) | EMISSIVITY |
| Human skin | 32 | 0.98 |
| Distilled water | 20 | 0.96 |
| Ice | -10 | 0.96 |
| Wet soil | 20 | 0.95 |
| Dry soil | 20 | 0.92 |
| Sand | 20 | 0.90 |
| Snow | -10 | 0.85 |
| Anodized aluminum | 100 | 0.55 |
The National Oceanic and Atmospheric Administration (NOAA) operates the US meteorological satellite program, while in Europe, the European Space Agency (ESA), a consortium of countries, also operates meteorological satellites. In addition, many other countries, as Russia, India, Japan and China operate satellites that supply similar data.
In this guide, only the NOAA meteorological satellites are described, since the imagery from these satellites is readily available to anybody with the proper equipment or through Internet.
The sensors on meteorological satellites, known as radiometers, measure radiation brightness in specific, narrow wavelength bands known as channels.
3.1 Polar orbiting satellites
Currently the US maintains at least two operational satellites in polar orbits. Each satellite pass within radio range of a ground station once a day traveling from north to south (descending mode), and once a day travelling from south to north (ascending mode). These passes are approximately 12 hours apart for one satellite.
The primary sensor on board the NOAA polar orbiting satellites is known
as the Advanced Very High-Resolution Radiometer (AVHRR). This is a five
channel scanning radiometer with 1.1 km resolution, sensitive in the visible,
near infrared and thermal infrared portions of the spectrum, (see Table
3.1).
|
|
Resolution | Wavelenght (m m) | Band's name |
|
|
|
|
|
|
|
|
|
|
|
|
|
|
|
|
|
|
|
|
|
|
|
|
|
The GOES mission is to provide frequent repetitive observations necessary to detect, track and predict severe weather systems. Two GOES satellites are generally used to provide coverage over the entire hemisphere. One satellite occupies the GOES East position, located over the Equator at 75° W, and the other one, the GOES West, at 135° W. In this guide imagery from GOES East is used, because it gives the best view of South America.
The GOES satellites are able to observe the full Earth disk in both VIS and IR regions of the spectrum.
In the imager of the new GOES satellites (as GOES-8) there are five channels, (see Table 3.2).
|
|
|
|
|
|
|
|
|
|
|
|
|
|
|
|
|
|
|
|
|
|
|
|
|
|
|
|
|
|
It is an introduction to image interpretation, it is not a comprehensive treatment of the subject.
4.1 VIS imagery
Figure 4.1.1, shows a VIS image from the GOES-8 satellite. Visible imagery
generally offers the highest spatial resolution. Land, clouds and ocean
are easily discernible. At night, no VIS imagery can be obtained from standard
meteorological satellites. Sea, big rivers and lakes appear dark in a VIS
image. In general, land appears brighter than the sea but darker than the
clouds. Clouds appear white or light gray in a normal display.
4.2 IR imagery
The most common IR band for meteorological satellites is in the 10 - 12.5 m m window. In this window the Earth's atmosphere is relatively transparent to radiation emitted from the Earth's surface. The IR imagery indicates the temperature of radiating surfaces. Clouds generally appear whiter than the Earth's surface because of their lower temperature. Figure 4.2.1, shows the IR image that corresponds to Figure 4.1.1.
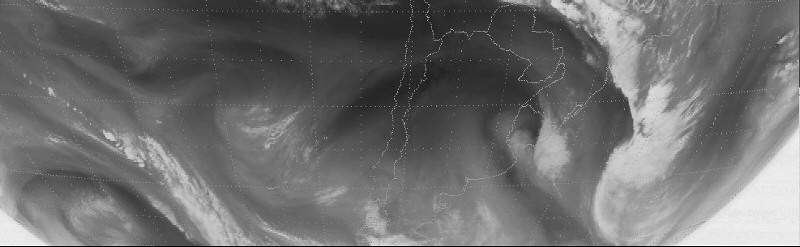
4.3 Water Vapor imagery
WV imagery is derived from radiation at wavelengths around 6.7 m m. At this wavelength, most of the radiation comes from the atmospheric layer between 600 and 300 hPa. Figure 4.3.1 shows the WV image taken at the same time as Figure 4.1.1 and 4.2.1. WV images are usually displayed with the emitted radiation converted to temperature. Regions of high upper tropospheric humidity appear cold (light) and regions with low humidity appear warm (dark). It means, when the upper troposphere is dry, the radiation reaching the satellite originates from further down in the atmosphere, where it is warmer and appears darker on the image. The highest clouds can be seen, but surface features cannot be detected because this is not a window channel. It is important to note that even when a WV image indicates a very dry upper troposphere, there may well be moist air near the surface.
4.4.3.7 m m imagery
The 3.7 m m window is situated in the small overlap region between reflected solar radiation and emitted radiation from the Earth and clouds (see Figure 4.4.1), which correpond in time to Figures 4.1.1, 4.2.1 and 4.3.1. At night the radiation in this imagery originates from terrestrial sources. During the day, there is a mixture of radiation of both solar and terrestrial origin, but the solar component predominates. See also Figure 4.7.1.1b below.
4.5 Multispectral analysis
Using imagery from more than one channel more easily identifies some
atmospheric phenomena or surface characteristics. Low level stratus is
often difficult to identify on an IR image because the cloud may have a
radiative temperature that is near that of the surface. On a VIS image,
however, stratus clouds appear bright in contrast to the darker background
of land and water. Also, the detection of thin cirrus clouds can be difficult
on a visible image because they are almost transparent to visible light.
However, these clouds are cold and thus present a strong cold signal on
the infrared image.
Image enhancement implies highlighting certain values or regions within
an image to emphasize and identify meteorological features and to separate
these from land and water.
Color enhacement implies the assignment of colors (or grades shades) to each pixel of an image based in the value of the pixel. Look-up tables specify the relation ships between inputand output values; a graph, called an enhancement curve, shows this realtionship.
4.7 Identifying thunderstorms in satellite imagery
4.7.1 Cloud clusters
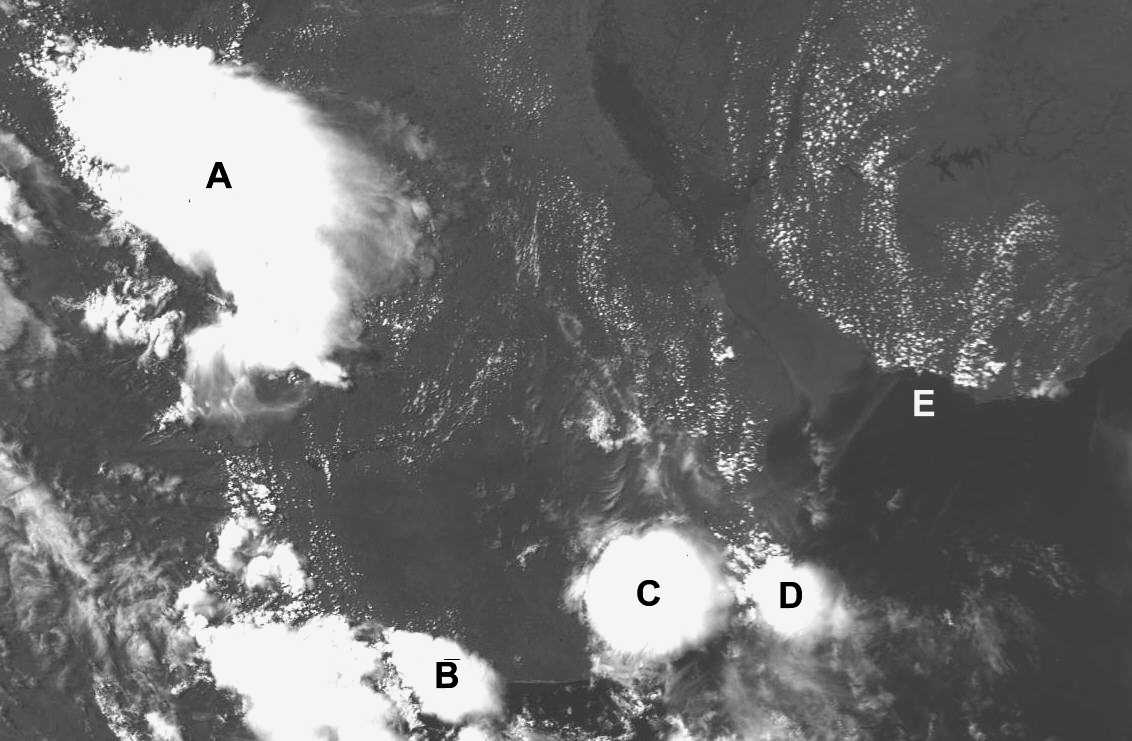
Clusters of clouds are associated with intense convective storms. Figure 4.7.1.1 shows clusters of very large Cb over central Argentina. The fibrous Ci streaks flowing away from the cluster labeled A broadly follow the wind pattern in upper levels. The VIS image (Figure 4.7.1.1a) shows by the highlights and shadows of the tops of the merged anvils, small areas with lumpy texture. These lumpy parts are the location where upcurrents overshoot above the Ci canopy. These features are indicative of intense convection, more severe weather and active precipitation regions within the clusters. However, the overshooting tops alone do not necessarily indicate that severe weather is occurring in a thunderstorm. Persistent overshooting tops are a more reliable indication of severe weather. In the case of cluster A, the downwind debris are extensive and thick, but the more recently formed clusters B, C and D, has not yet generated such an extensive anvil.
The 4.7 m m image, (Figure 4.7.1.1b) shows black areas where the solar radiation has been totally absorbed by the ice particles in the anvils of the storms.
 a)
a) b)
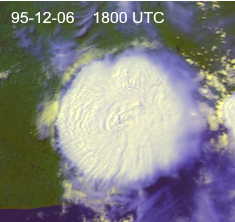
b)Figure 4.7.1.1: a) VIS and b) 3.7m
m images at 1800 UTC over central Argentina on 06 Nov 1995 from NOAA-14
AVHRR.
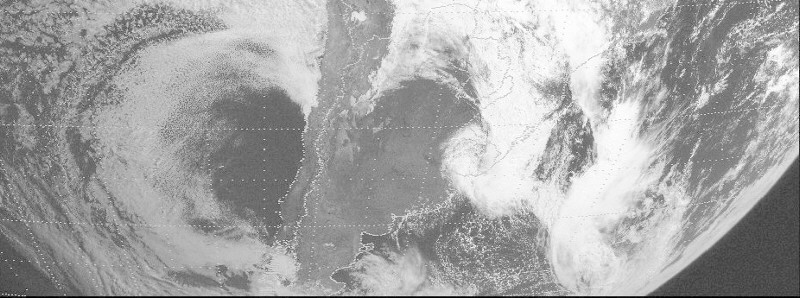
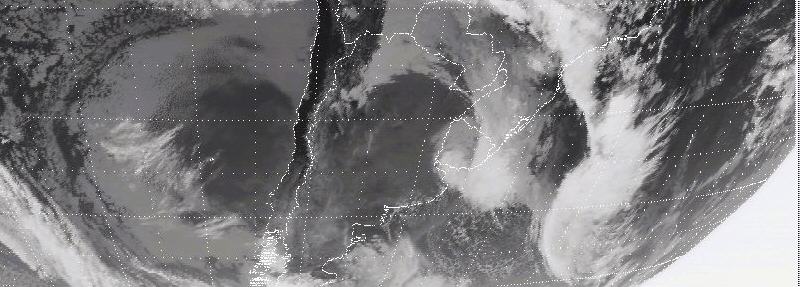
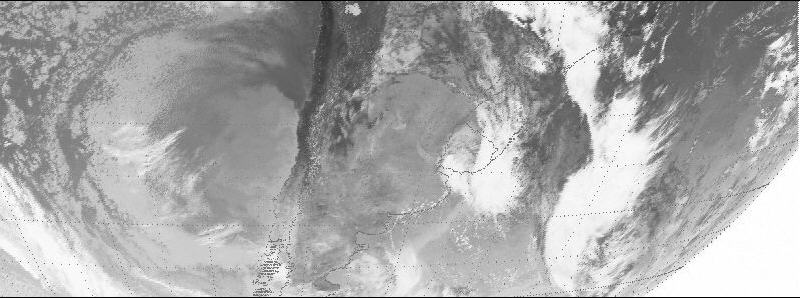
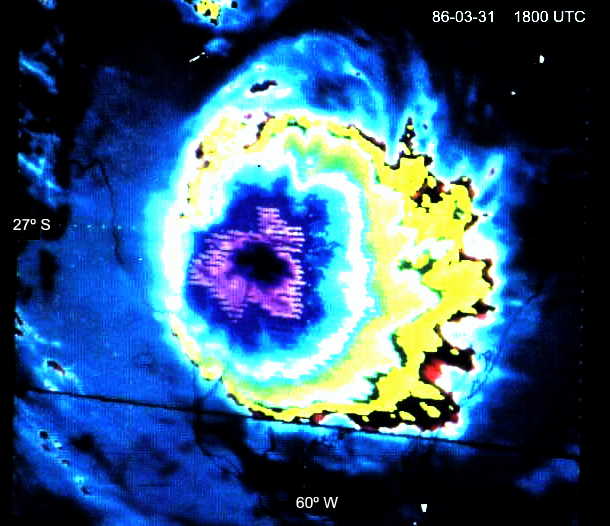
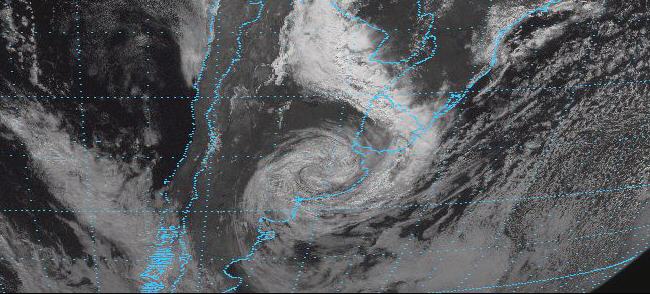
Figures 4.8.1.a) to d) shows the clouds associated with a large mid-latitude cyclone over Argentina as revealed by VIS, 3,7 m m, WV and enhanced IR images.
 a)
a)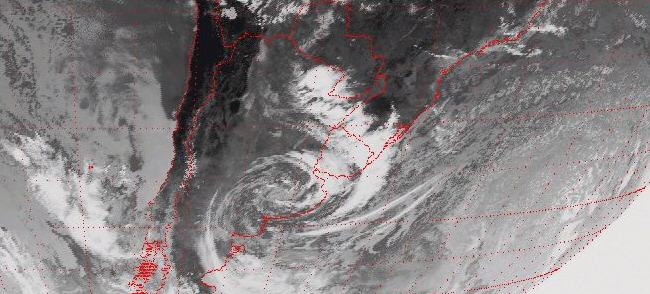 b)
b)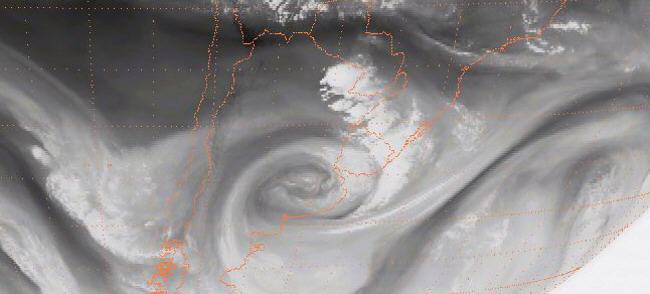 c)
c) d)
d)Figure 4.8.1 Mid-latitude cyclone and other cloud features. a) VIS image, b) 3.7 m m image, c) WV image, and d) enhanced IR image (GOES-8, 09:30 Apr 27, 1999).
Satellite Meteorology; An introduction. S. Q. Kidder and T. H. Vonder Haar. 466 pgs. Academic Press, NY, 1995,.
Atlas of satellite observations related to global change. R. J. Gurney, J. L. Foster and C. L. Parkinson, editors. 470 pgs., Cambridge University Press. 1993.
Weather Satellites: Systems, data and Environmental Applications. P. K. Rao, S. H. Holmes, R. K. Anderson, J. S. Winston and P. E. Lehr, editors. 503 AMS, Boston, 1990.
Atlas de imágenes Meteosat. C. A. Brimacombe. 492 pgs. Pub. B-32. España,. 1991.
An Introduction to Satellite image Interpretation. E. D. Conway. 242 pgs.,The Hopkins University Press. Baltimore, 1997.
rsd.gsfc.nasa.gov/goes/text/goesnew.html
![]()