
José M. Nuñez
Servicio Meteorológico Nacional , Conicet
Norberto L. Di Lorenzo Dto.Cs.
de la Atmósfera ,FCEyN , Universidad de Buenos Aires
Gorki Jover Servicio Meteorológico
de la Armada ,República Argentina
1. INTRODUCCION
Regularly , Buenos Aires province
northeast is affected by storms of variable intensity . In particular ,
during Spring and Summer months .
For this reason is necessary to
typify them , to have at one’s disposal techniques for its detection ,
and forecast its evolution if it were possible . Normally , storm that
appear in the region are associated with frontal activity , upper system
, squall line and air masses .
Storm developement studies have
been done in synoptic scale and mesoscale, using cyclogenetical probability
and of precipitation indeces in determining its skill degress, Ciappesoni
et all (1994) . In general , the problem of Nowcasting was stated for the
region by Nuñez et all (1991) .
Our purpose is to analyze conduct
and characteristics of the main precipitation processes above mentioned
.
2. CASE STUDY SELECTION (SQUALL LINE ANALISIS ON 16 OCTOBER 1993)
2.1 Synoptic - aerological situation
On 16 October 1993 at 0900 Z a prefrontal
trough that is on the line Mendoza , South Cordoba , San Luis and Necochea
(Buenos Aires province) slightly push forward . At the same time a cold
front is over Bahía Blanca (South Buenos Aires province ), At 1200
Z the front and the trough get together on the line San Juan , Mercedes
(San Luis) and Necochea .
At 1500 Z there are storms in Junín
,Bolívar and Tandil . At 15.15 HOA(Argentine Oficial Hour ) precipitation
begin to be recorded in the Buenos Aires Metropolitan Region , (San Miguel
,Castelar and Ezeiza ) .
Inestability index obtained from
radiosonde data at 0900 Z , 10.16.93 not have storm condition . Indices
K , Showalter and Total Totals show them the day after , at 0900 Z on 10.17.93
when compared with the previous data, table 1 .
In not any case index pointed out
severe storm conditions and hail ; notwithstanding some of the cells of
the analyzed line showed such caracteristics .
| Instability indices | 10/16/93 Date | 10/17/93 Date |
| K |
|
|
| Sh |
|
|
| LI |
|
|
| FM |
|
|
| TT |
|
|
| Sweat |
|
-------- |
2.2. From pluviometric field
Two of the stations that recorded
the storm precipitation were:
Castelar INTA , lat : 34o
40’ S and long. : 58o 30’ W
Buenos Aires , lat : 34o
35’ S and long. : 58o 29’ W
From them precipitation maxima , between 15,15 HOA (Argentine Oficial Hour) and 18,45 HOA is given in table 2
|
|
|
|
|
|
|
|
|
|
|
|
|
|
|
|
|
|
|
|
|
|
|
|
|
|
|
|
|
|
3. AVAILABLE EQUIPMENT
Radar M33 , S band was employed .
Located at Ezeiza Airport , lat.: 34o50’S and long.:58o
32’ W
Furthermore , Ezeiza radiosonde
data , and the National Weather Service pluviometric network .
4. 16 OCTOBER 1993 STORM ANALYSIS
ACCORDING RADAR DATA
Although starting at 15:00 HOA storms
were detected by weather radar , only at 16:30 HOA .
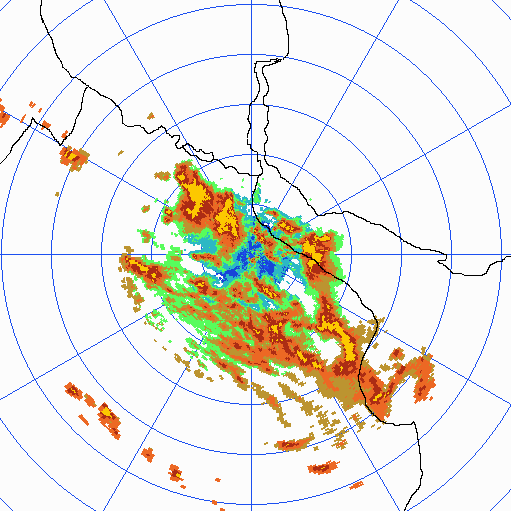
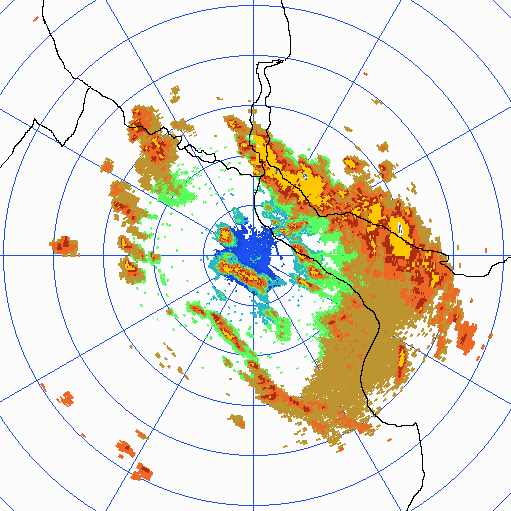
At 16:36 HOA squall line shape is
observe ( see fig.1) and later on at 18:36 HOA this is totaly developed
and intensified.
 |
 |
General behavior of the line could
be determined through analysis of all disposable material between 1630
HOA and 2030 HOA , each 5 min . The system was divided in two areas for
movements study. First included the line principal part and the second
cell of anomalous movement
According to Quinteros et all (1984),
in this region , for 22 analized cases general characteristics are the
following :
SW to EN movement direction , concave
or convex forms ; center of gravity mean velocity of the line is 55,4 Km/h
and its mean displacement direction 280o , mean longitude of
290 Km , 52,6 Km maximun mean wide and
8.350 Km² of mean area .
16 october 1993 line had 400 Km
longitude and 60Km wide maximun . Mean displacement velocity was 37Km/h
, NE direction ; 58 Km/h southeastmost and 40 Km/h northwest, counterclockwise
.
For the most part of the storm life’s
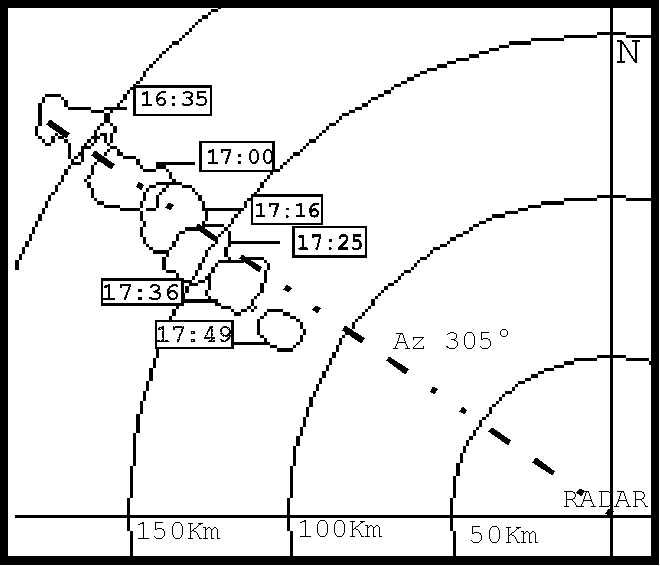
cycle , three high reflectivity centers wereactive.The anomalous behavior
of a cell displaced from behind of tline is showed in Fig.2 , with 75 Km/h
velocity and Az . 305o

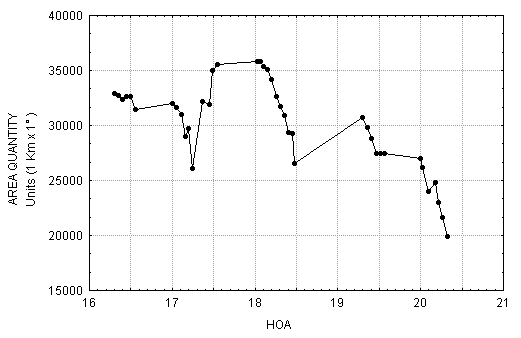
Figure 3 show time variation of ocupied area by storm echoes , where greater values are recorded between 1725 and 1810 HOaccordingly to greater precipitation intensity values (see table 2) .

During this period an area a storm
52.000 Km² was covered by the line .
Mean precipitation area (ATI) computed
for 25 dBz level was 69.538,8 Km²/h , the mean rain rate (R) was 3,23
mm/h and the mean precipitation total quantity (P) was 12,92 mm.
These and Table 2 values shows that
the storm was of moderate intensity but widely spread . Intense convective
activity , hail included ,come to pass in some isolated points with no
inflence over mean values .
It showed a mean displacement velocity
of 37 Km/h over continent and disminished to 27 Km/h over River Plate basin
5. NOWCASTING ANALYSIS
At first glance general aspect of the storm allows to watch squall line movement from SW to EN with a mean velocity of 30 Km . For this experience and for Nowcasting, Cross Correlation method was used , Austin and Bellon (1974), being applied to divers sectors selected by structure of reflectivity field analyzed, and defined by 2 AZ values and 2 in range, for each one .
Several results were observed.Most
of them with high values of the g correlation coeficient ,(see table 3)
. For different sectors , 1,2,8 and 9 columns show different moments with
respect to the beginning of the storm , distinct movement analysis intervals
and different speed and dircetion values .
For the 8 analyzed cases , former
three belong to propagation effects , next two displacement and to the
last three the greastest weight concerns to the displacement .
Its is to be noted 6th
case showing a value of 0,780 instead of 1 . This suggests an evolutive
effect .
|
|
|
|
|
|
|
|
|
|
|
|
|
|
|
|
|
|
|
|
|
|
|
|
|
|
|
|
|
|
|
|
|
|
|
|
|
|
|
|
|
|
|
|
|
|
|
|
|
|
|
|
|
|
|
|
|
|
|
|
|
|
|
|
|
|
|
|
|
|
|
|
|
|
|
|
|
|
|
|
|
|
|
|
|
|
|
|
|
|
The squall line show a main mass
with 3 high reflectivity centers which move quasi as whole .
The squall line analyzed is a
typical one of our region but greater than mean value , with SW to NE movement
direction .
Particularities detected are
:
- When the main mass of the line pass from the continent to de la Plata estuary slow down it velocity from 37 to 27 Km/h . Intensifying reflectivity values and high reflectivity center areas .
-Anomalous movement cells is presented , Az :305O and high velocity : 75 Km/h
-With a mean velocity of 32 Km/h , southeastermost comes up to 58 Km/h and northwest to 40 Km/h , clear counterclockwise .
-It is necessary to discriminate the results according to the moment in the life’s cycle of squall line and it forming .
-Differnt moments and places chosen give distinct results , depending on displacement and propagation that take place in the respective sector .
-Up to now we do not think it suitable to forecast future cells location , at intervals longer than 30 min .
Acknowledgments
The autors appreciate cooperation
of Mr. Kyu Hyung Kyung who implemented part of the sofware for radar image
analisys.
References
1. Austin G.L. and A. Bellon , 1974 : The use of digital weather radar records for short-term precipitation forecasting , Quart. J.R. Met.Soc. ,100 ,658-664 .
2. Ciappesoni HH. , J.M.Nuñez , M.A. Giachino , M.A. Gan and N.Arai ,1994 : Some characteristics of the life cycles of extratropical cyclogenes in Southern South America .Int.Symp. on life Cycles of Extr. Cyclones . June 1994 , Bergen , Norway.
3. Nuñez J.M. ,M.A. Giachino
, M.E. Saluzzi and N.L.Di Lorenzo,1991 : The problem of the Nowcasting
in the River Plata Basin , PartI: Measurement and Tratament of Data by
Radar and Employment of numerical Analysis .
25 th Int, Radar Conf. , AMS June
1991 , Paris , France .
4. Quinteros C.Y. , N.L. Di Lorenzo
and E.A.Caimi ,1984 : Ecos en linea dentro del alcance del radar M33
.
3er Congreso Brasileño
de Meteorología , Belo Horizonte , Brasil ,1984
5. Servicio Meteorológico
Nacional (SMN) , Boletín Climatológico , octubre 1993
,vol V , NO10 p.p. 46-50 .
Buenos Aires , Argentina