Print Version
Introduction
About the Lesson
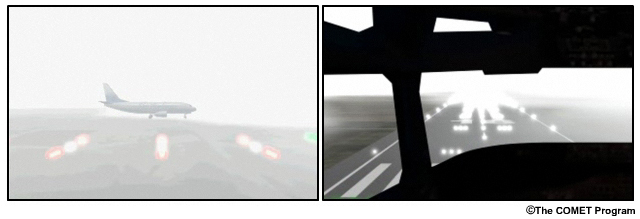
If you're an aviation forecaster, you've undoubtedly dealt with fog and low clouds, and know the impacts that the associated low ceilings and visibility can have on aviation operations - from causing flight delays and passenger discomfort to even closing airports. You also know how challenging it can be to forecast fog and low clouds. Numerical models have difficulty predicting features like these that often form on a local scale. During the daytime, low cloud and fog can usually be seen in visible imagery, while at night, they can only be identified with multispectral infrared products. Differentiating between low cloud and fog is not possible with satellite imagery alone because the sensors cannot see below cloud top.
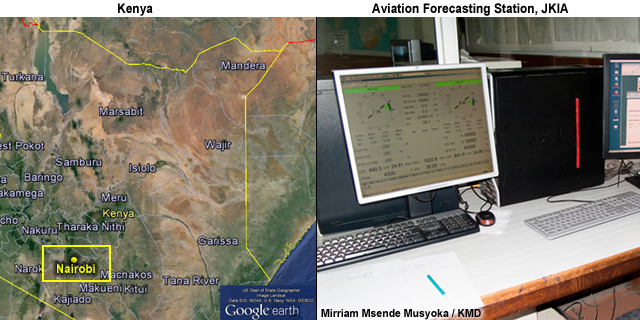
This lesson aims to improve aviation forecasts of fog in the African airspace by teaching forecasters to make more accurate forecasts using satellite imagery, numerical weather prediction, and other available data. We will present a process for diagnosing and forecasting fog, and apply it to a case over the Nairobi, Kenya region on 20 July 2012. You will assume the role of aviation forecaster on the night shift at Nairobi's Jomo Kenyatta International Airport (JKIA). You will analyze various products to determine whether the current Terminal Aerodome Forecast (TAF) is valid or needs to be amended and then follow conditions to see what happened.
The lesson is intended for aviation forecasters, general weather forecasters interested in aviation meteorology, pilots, and meteorological forecasting instructors and students (WMO). By the end of the lesson, learners should be able to:
- Describe the impacts of fog and reduced visibliities on aviation planning and operations
- Diagnose the development, presence, and evolution of radiative fog as required in aviation forecast and warning preparation using satellite imagery and other tools
- Develop skills in writing and amending a TAF for the development of radiation fog that meet customers needs and follow International Civil Aviation Organization (ICAO) standards
The following prerequisites will enable learners to get the most out of the lesson:
- Basic Instruction Package in Meteorology (BIP-M, available at http://www.wmo.int/pages/prog/dra/etrp/documents/1083_Manual_on_ETS_en_rev.pdf
- Basic ability to interpret satellite images, RGB products, and NWP products for forecasting fog
- Basic understanding of fog development
- Ability to interpret METAR and TAF codes and tephigrams
- Understanding of the steps in the TAF-writing process
Some of this information is found in the following COMET lessons, which learners are encouraged to take before starting the case study:
- Writing TAFs for Ceilings and Visibilities, Africa Edition lesson (https://www.meted.ucar.edu/training_module.php?id=1012), which outlines the TAF-writing process and applies it to a low cloud/fog case over Cape Town, South Africa
- Fog: Its Processes and Impacts on Aviation and Aviation Forecasting (https://www.meted.ucar.edu/training_module.php?id=795), which provides extensive background information on fog formation and its impacts on aviation forecasting
This lesson is one of three aviation weather case studies developed by the ASMET project to improve aviation forecasting in Africa. The other two lessons focus on convection and clear air turbulence, and are accessible via the ASMET website (http://www.meted.ucar.edu/communities/asmet/). The ASMET case studies also support COMET's Review of Aeronautical Meteorology Africa online learning curriculum, which provides training that supports the WMO/ICAO competencies for Aeronautical Meteorological Forecasters.
Finally, note the Aviation Resources and map of Kenya links in the Navigation Bar on the left. They are available throughout the lesson for you to access. The Aviation Resources include the flight categories, guidelines for using "BECMG" and "TEMPO" groups, conditional groups, and cloud codes.
About Fog
Fog is the suspension of very small water droplets in the air that reduces surface-based visibility. Some of the more common types are radiation fog, advection fog, upslope/terrain-induced fog, rain/post-frontal fog, blocked flow fog/stratus, and valley fog. This lesson focuses on radiation fog, which affects many tropical regions, including Eastern Africa.
Radiation fog is caused by nocturnal infrared cooling at or near the ground surface. It forms and completes its life cycle in situ (although it can be advected under the right conditions). The key low-level ingredients required to generate radiation fog are moisture (high relative humidity), rapid cooling, and calm or light winds (generally 5 kt or less), as shown in the graphic below.
Additional characteristics of radiation fog include:
Duration |
Generally short duration (< 24 hr), often dissipating by afternoon |
Intensity |
Considerable variation, especially over open areas or near water sources where fog tends to be denser; dense areas may be isolated but can present an aviation hazard |
Coverage |
Typically remains in one place, and is patchy and localized |
Depth |
Varies with the depth of the radiation inversion |
Time of Day |
Tends to form late at night or in early morning hours; can also form after precipitation that clears near or after sunset |
Fog typically dissipates within a few hours with increasing wind, cloud cover, advection of drier air, and/or solar radiation.
For more information on the various types of fog, access the COMET lesson Fog: Its Processes and Impacts on Aviation and Aviation Forecasting at http://www.meted.ucar.edu/fog_int/navmenu.php?tab=1&page=4.0.0.
Case Study: 00 UTC
Case Setup
Assume that you are an aviation forecaster working the 16 to 04 UTC shift (7 PM to 7 AM local time) at Nairobi's Jomo Kenyatta International Airport (JKIA) on 19 to 20 July 2012.
The region is usually covered by stratiform clouds in June, July, and August. That's due to temperature inversions resulting from cold Mascarene high pressure cell that originates from the southeastern part of Africa. Late afternoons, evenings, and nights are usually cloud-free, while mornings and daytime are typically cloudy.
TAF
You are working a joint shift with another aviation forecaster, who wrote the 00 UTC 20 July TAF for JKIA valid to 06 UTC 21 July. You are responsible for monitoring conditions overnight and writing the 06 UTC 20 July TAF. Note that local time in Kenya is +3 UTC.
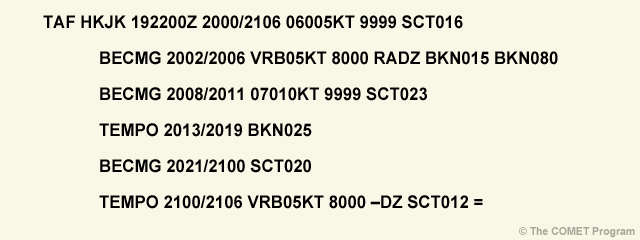
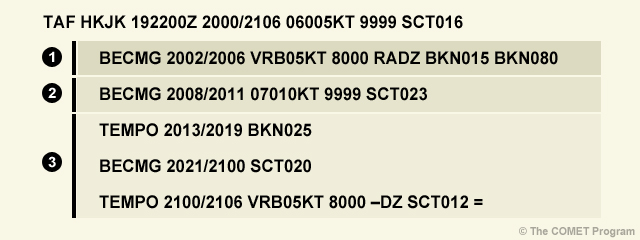
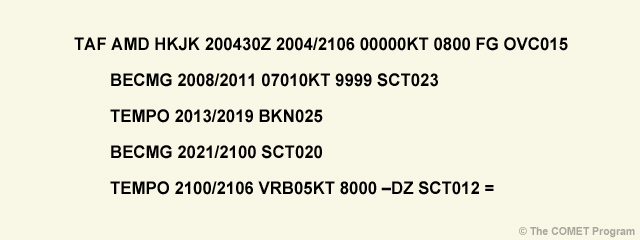
Review the 00 UTC 20 July TAF that was prepared at 22 UTC 19 July, then answer the question below. Note that you can roll over each section of the TAF for a decoded version. Click to review the flight categories.
How will this forecast impact aviation customers? Select the option(s) that apply, then click Done.
The correct answers are A and C.
The forecast calls for conditions to fall below MVFR conditions at 02 UTC and remain there until 06 UTC. This means that pilots expecting to fly under VFR conditions will need to plan an alternate destination and take on more fuel. Conditions are forecast to improve by 08 UTC.
IFR conditions are not forecast in the period so B incorrect. Conditions are forecast to be below VFR criteria, making D wrong as well.
Next we'll compare the 00 UTC TAF to the 00 UTC METAR, sounding, and surface chart.
METAR
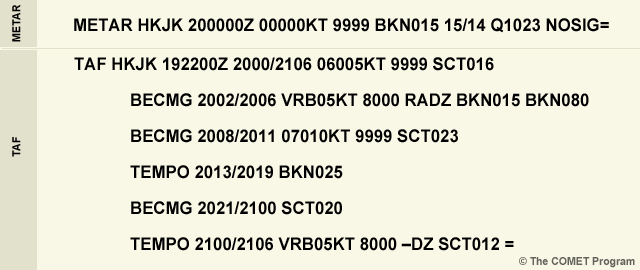
The METAR for 00 UTC 20 July is shown above. How are current conditions different from those described in the TAF? Select the correct option.
The correct answer is A.
The ceiling, which was predicted to move in between 02 and 06 UTC, has come in early. B is incorrect because drizzle is not observed at 00 UTC. The observed wind at 00 UTC is calm, so C is incorrect, and D is not correct because rain was not recorded at 00 UTC.
Sounding
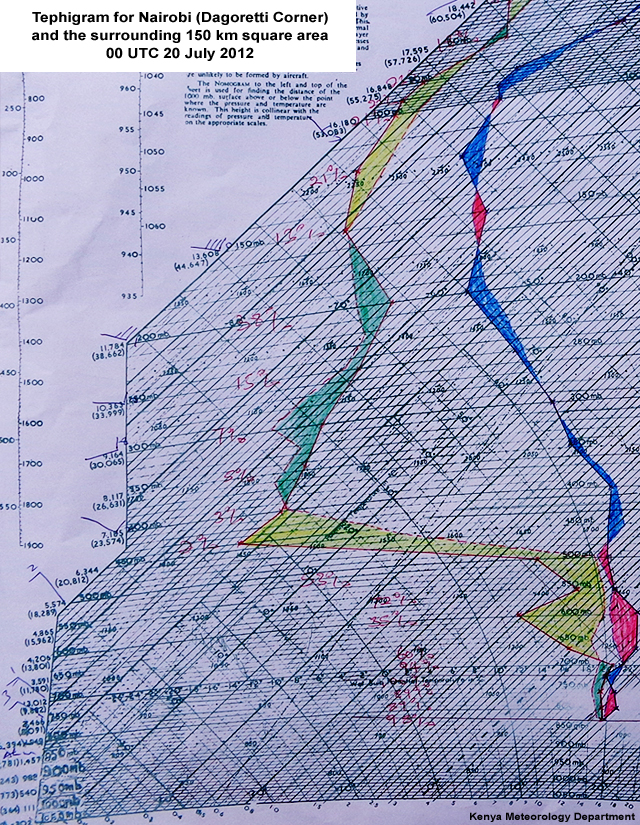
Here's the sounding for Nairobi (Dagoretti Corner) at 00 UTC 20 July. Click the tabs to study both views, then answer the questions below.
Plotted Tephi
Plotted Tephi Close Up
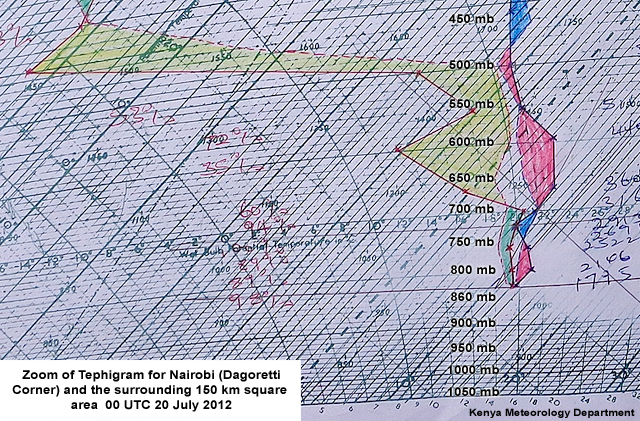
Question 1: What are conditions in the upper troposphere between 700 and 300 hPa? Select the correct option.
The correct answer is D.
Conditions above 700 hPa are considerably drier than in the lower atmosphere. A wind shift occurs around 400 hPa but it goes from generally northwest to generally southeast above that level, making A incorrect. B is wrong because the dew point depression increases considerably above 700 hPa, indicating that clouds are not present above that level. Winds in the upper levels are stronger than seen below 700 hPa, making C incorrect.
Question 2: Are there any indications of cloud below 300 hPa? If so, choose the right level.
The correct answer is B.
The temperature and dew point lines are close enough to indicate clouds in the layer between 750 and 700 hPa.
Question 3: How would you characterize the lower atmosphere? Select the option(s) that apply, then click Done.
The correct answers are A and C.
The stable layer between 720 hPa and 690 hPa is acting to decouple the lower levels of the atmosphere from the levels above. Air below is closer to saturation and the saturated layer corresponds to the level of the observed stratus clouds. A surface-based inversion is developing because the surface is cooling more rapidly that the air above it, making B incorrect. The winds in the stable layer are lighter than those seen above, making D wrong as well.
Question 4: How would you expect the conditions to affect the stratus that formed at 00 UTC? Select the option(s) that apply, then click Done.
The correct answers are C and D.
The stability and moisture at low levels, calm winds, and dry air above the stratus will all work together to maintain and perhaps deepen the cloud layer overnight. Since the winds are relatively weak in the layer near the surface, which is stable overall, A and B are incorrect.
Radiative heat loss is maximized when the layer immediately above the fog or low clouds is relatively dry, the winds are weak, and there are no cloud layers aloft. On a clear night, the rate of fog-top radiational heat loss is much more rapid than that in the lowest few meters of the atmosphere, which can result in thickening of the cloud layer.
SYNOPS
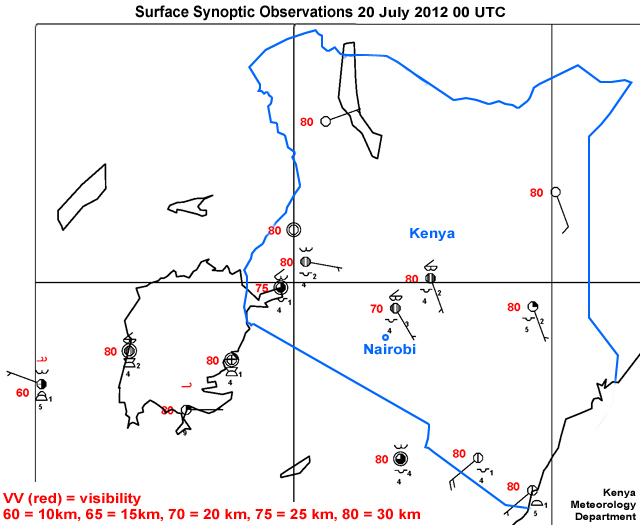
Here's the surface synoptic chart for 00 UTC 20 July. What conditions are indicated around Nairobi? Select the option(s) that apply, then click Done.
The correct answers are A, B, and D.
The 00 UTC synoptic chart shows weak winds, with visibilities greater than 10 km (actually 20 to 30 km). The synoptic observations indicate stratocumulus clouds at stations in Nairobi and the western parts of Kenya. Option C is wrong because all stations observing stratocumulus also report some mid-level cloudiness.
Weather Story
Now that you have reviewed the TAF and some observational data, you have a basic idea of the state of the atmosphere, which we refer to as your “mental model.” From this, we can build the “weather story,” which describes the current conditions and how they are expected to evolve over the forecast period. We'll start by viewing satellite images and products.
Keep in mind what we've seen so far:
- Stable conditions with weak flow at low levels
- The presence of stratus at 1500 ft, which has brought conditions below VFR
- Dry air in the middle and upper levels of the troposphere, which will promote radiational cooling and should help maintain the stratus layer
One question that we need to answer is whether the stratus layer will reduce radiational cooling at the surface and suppress fog formation. The 00 UTC METAR indicated that the surface dew point was just 1 degree C lower than the temperature, so very little additional cooling is necessary for fog to form.
Next we'll examine the satellite imagery to determine the areal extent of any clouds and possible fog.
Satellite Images and Products
Fog and low stratus can be inferred from multispectral RGBs imagery and derived products and from visible channel imagery during daytime. The following tables describe the satellite products that are useful for identifying fog and low-level clouds. Review the information, then we will look at some of the key products for the case.
SINGLE CHANNELS AND DIFFERENCES |
COVERAGE |
USE/INTERPRETATION |
Water vapour 6.2 µm
|
24 hrs |
|
Ch 4 minus 9 (MSG IR 3.9 - 10.8 µm) temperature difference ("fog product") |
24 hrs |
|
EUMETSAT's Meteorological Product Extraction Facilities (MPEF) produce a range of meteorological products derived from satellite data. One of the most useful derived products for fog detection is the Cloud Analysis Image or CLAI. The CLAI product is produced every three hours (corresponding to the ECMWF analysis/forecast periods) and helps distinguish different layers of clouds.
PRODUCT |
COVERAGE |
USE/INTERPRETATION |
MSG Cloud Analysis Image (MPEF CLAI) |
24 hrs |
|
The following RGBs also provide useful information about fog and low cloud.
RGB PRODUCT |
COVERAGE |
USE/INTERPRETATION |
Fog / Low Clouds (Night Microphysics) RGB |
Nighttime only for cloud microphysics, monitoring of fog and low stratus |
|
Day Microphysics RGB |
Daytime only for cloud microphysics; cloud classification, convection, fog, snow and fires |
|
24-hour Dust Microphysics (IR 12.0 – IR 10.8, IR 10.8 – IR 8.7, IR 10.8 µm) |
24-hour dust and cloud classification |
|
Natural Colour RGB (1.6, 0.8, 0.6 µm) |
Daytime only |
|
Reviewing the Products, Part 1
Click the tabs to view the water vapour, night microphysics, fog, and CLAI products for 00 UTC 20 July 2012. Note that there is a question below each product. Answer it before moving on to the next tab!
Water Vapour
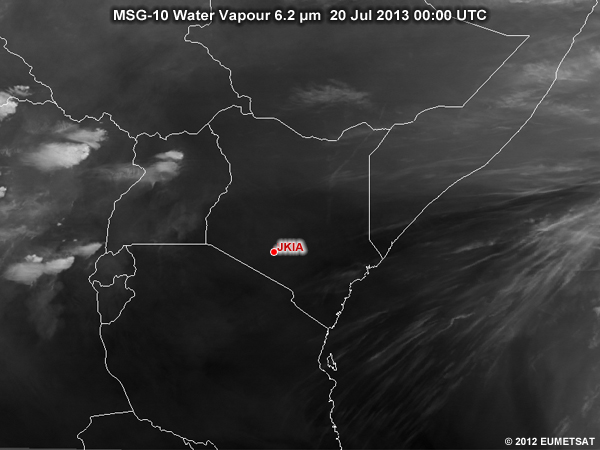
The water vapour image shows: (Select the correct option.)
The correct answer is B.
Now scroll up and select the Night Microphysics tab.
Night Microphysics RGB

The night microphysics RGB shows: (Select the correct option.)
The correct answer is A.
Now scroll up and select the IR Fog Product tab.
IR Fog Product
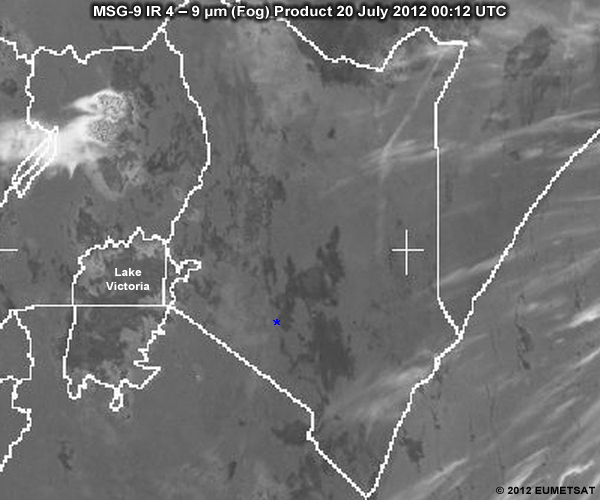
The IR fog product shows: (Select all that apply.)
The correct answers are A and B.
Now scroll up and select the CLAI tab.
CLAI
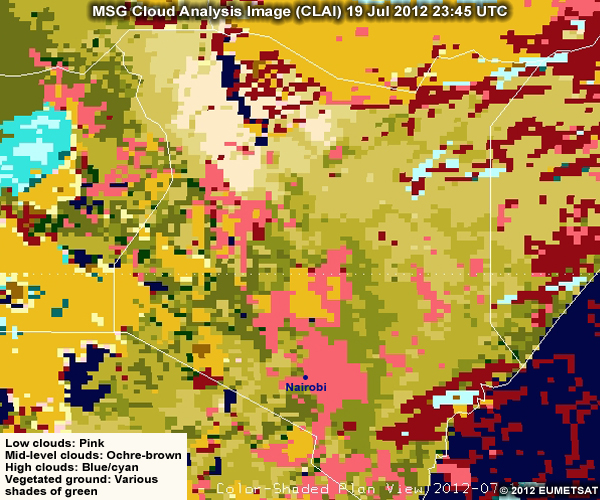
Over Nairobi, the CLAI product shows: (Select the correct option.)
The correct answer is B.
The satellite products support what was seen in the soundings - clear skies above the stratus deck. The dark grey colour in the water vapor imagery indicates that the middle troposphere is relatively dry. These conditions promote radiative cooling and deepening of the stratus layer, and support the development of radiation fog. Note that fog itself cannot be detected on water vapour images. Stratus is evident just east of Nairobi in the light yellow area seen in the microphysics RGB, and in the dark areas in the fog product. The pink areas in the CLAI product are the lowest cloud layers but we cannot determine whether the clouds are actually fog or low stratus.
Reviewing the Products, Part 2
Answer the final two questions below the tabs about the satellite products.
Water Vapour
Night Microphysics
IR Fog Product
CLAI
In general, can you differentiate low clouds from fog in these satellite products? Select the correct option.
The correct answer is B.
Satellite imagery shows data from cloud-top level, making it difficult to differentiate between fog and stratus. We can, however, sometimes identify fog when it follows terrain features, such as mountains, or if we animate multiple images.
Based on the current weather situation, how might conditions evolve? Select the correct option.
The correct answer is D.
Conditions need to be closely monitored to see if fog forms at the airport with additional nighttime cooling. Winds were calm at 00 UTC so A is incorrect. We've seen that the atmosphere is stable up to 700 hPa, so B is incorrect. With sunrise, we would anticipate that the fog and low clouds might be more likely to dissipate, so C is incorrect.
Building the Weather Story
Recall our findings from the METAR, tephigram, and SYNOPS: stability at low levels, calm winds, drier conditions aloft and stratified low-level clouds.
Based on the satellite imagery, how would you change your mental model about the current conditions? (Select all that apply.)
The correct answers are A, B, and C.
The areal coverage of the low clouds shows that they are relatively widespread. It seems that the low clouds will persist at least overnight and may reduce radiational cooling at the surface and thus the chance of formation of fog. However, we have not yet looked at numerical weather prediction (NWP) data to see how the wind field is expected to change. In addition, the dew point depression at the airport is only one degree, so very little cooling is necessary for fog to initiate.
Next, we will look at some of the NWP data available for 00 UTC and evaluate how well the model depicts the weather situation.
Charts to Check
As we continue to develop our weather story, we take the mental model developed while examining the observational data and start to think about how the situation will change over time. We will focus on the 00 UTC to 09 UTC time period and see how evolving conditions will affect aviation operations. But first we will look at the 00 UTC analysis and see how it compares to the observations. If they compare favourably, we can have greater confidence in the forecasts.
Here are the ECMWF charts that we will check. Review the information, then we will examine each one.
CHART |
WHAT TO LOOK FOR |
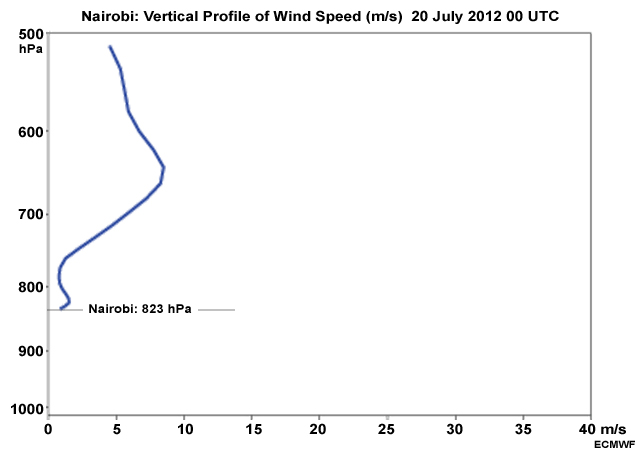
Wind vertical profile: sfc to 700 hPa |
Wind speed values and how they change with height. Are winds sufficiently weak to promote the formation of radiation fog? |
Humidity: sfc to 700 |
Boundary layer humidity values. Is the atmosphere sufficiently moist to become saturated with additional cooling? |
Surface pressure |
Areas of relatively high pressure and how the pattern changes with time. |
Checking the 00 UTC Charts
Click the tabs to review the 00 UTC analyses of wind speed, humidity, and MSLP, then answer the questions below. Note that the Nairobi station is at 823 hPa.
Wind Speed
Humidity
MSLP
How well do the 00 UTC NWP analyses agree with the observational data? Select the correct option.
The correct answer is B.
The initial conditions, represented by the 00 UTC forecast, capture the stable conditions in the surface pressure chart, the moisture conditions in the cross-section, and the low-level calm winds in the wind profile. Since the analysis does a good job of representing conditions at 00 UTC, we can have good confidence in the model forecasts.
Checking the 00 to 12 UTC Charts
Now we'll review the 00 to 12 UTC forecasts, paying particular attention to conditions that could impact winds, relative humidity, and the stability of the lower levels of the atmosphere. Click each tab to view the forecasts, then answer the questions below.
Windspeed
Humidity
MSLP
Question 1: Based on the model forecasts, how do you expect the low-level winds to change? Select the correct option.
The correct answer is C.
Low-level winds in the stable layer do not change significantly over the forecast period. They are light but not calm, making D incorrect. Winds in the upper levels do not show a significant increase so A is incorrect. More generally, winds are not expected to increase significantly over time so B is also wrong.
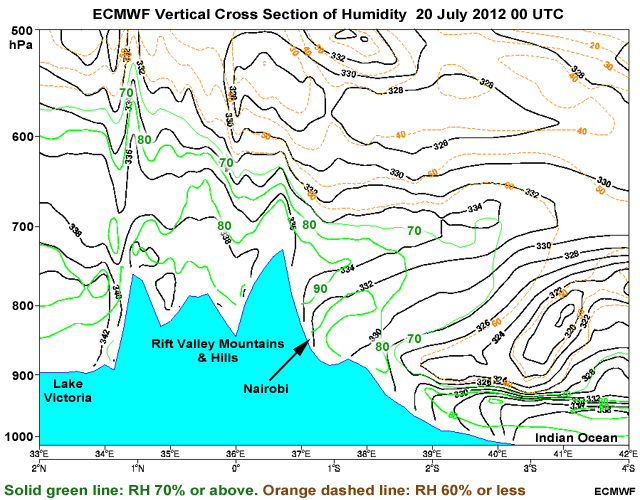
Question 2: What does the relative humidity cross section indicate about the atmosphere around Nairobi? Select all that apply.
The correct answers are B and D.
During the early morning hours (00 to 06 UTC), the air near the airport is relatively moist up to 700 hPa, with values of 70% or above. The air above 700 hPa is much drier, with values falling below 30%. By late morning, the moist layer is lifted and the air in the lowest levels dries.
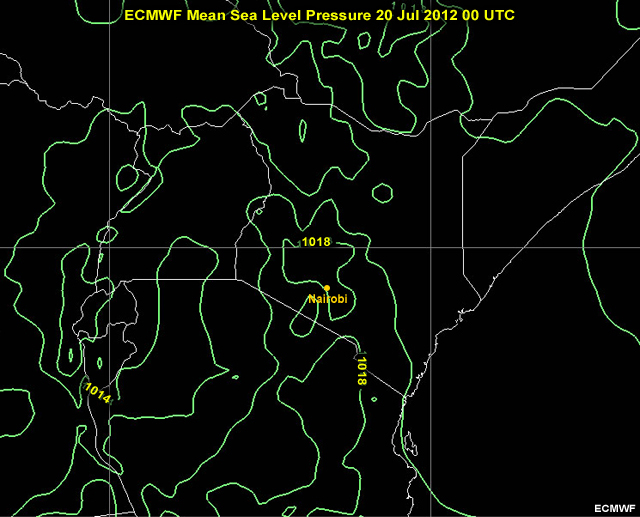
Question 3: What seasonal weather system is indicated by the mean sea level pressure configuration over the region? Select the correct option.
The correct answer is A.
The main meteorological feature during this season is generally the East African ridge, which is over the continent at this time. The ridge rises from the Mascarene high pressure cell in the south. The East African low-level jet is present but further to the east over the Indian Ocean. The jet brings cold air from the south, which creates a temperature inversion that leads to stable conditions at lower levels and unstable conditions aloft. This is a conducive environment for the formation of low clouds.
Question 4: Based on the NWP data, how will the forecast conditions affect the stratus deck and the potential for the development of fog? Select all that apply.
The correct answers are B, C, and D.
Moist conditions in the lower levels and the dry middle troposphere will enhance radiative cooling. This will promote the development of fog and support the persistence of stratus clouds.
Comparing Obs. Data with NWP
Here's what we've seen so far. The observational data show:
- Stability and moisture at low levels, with calm winds and stratified low-level clouds over Nairobi and the vicinity
- Drier conditions in the middle levels of the troposphere
The NWP charts show:
- Moisture below 700 hPa will continue through the morning hours (00 to 06 UTC) so existing clouds can be expected to persist and the development of fog is possible.
- The vertical wind profile does not change significantly. There are calm winds at low levels, which are conducive to the development of low cloud and fog
- The dry middle troposphere will enhance radiative cooling and support the maintenance of stratus clouds and the development of fog; the air near the airport is relatively moist up to 700 hPa, and very dry above
- High pressure associated with the East African ridge is over the continent and expected to persist until 09 UTC; this creates an environment conducive for the formation of low clouds and fog
Windspeed
Humidity
MSLP
Question 1: How are conditions near Nairobi expected to change between 06 UTC and 09 UTC? Select the correct option.
The correct answer is B.
The humidity forecast show drying occurring between 06 UTC and 09 UTC. High pressure is forecast to build over this time and winds are not expected to change much over that time, so options A, C, and D are incorrect.
Question 2: Based on the forecast, what aviation-related features or conditions might be of concern and need to be monitored over the next few hours? Select all that apply.
The correct answers are A and C.
Ceilings and visibility are the main concerns over the next few hours. Conditions need to be closely monitored, especially for the development of fog. If it forms, it will cause poor visibility, which can delay departures and arrivals. It can also increase operational costs through additional fuel consumption and possibly result in aircraft rerouting to alternate aerodromes. Passenger comfort may also be compromised.
Case Study: 04 UTC
METARS
It's now 04 UTC (07 local time) and the sun has risen. The 01 to 04 UTC METAR observations show that fog has formed while the wind remains weak and variable.
00 UTC: METAR HKJK 200000Z 00000KT 9999 BKN015 15/14 Q1023 NOSIG= |
01 UTC: METAR HKJK 200100Z 02003KT 9999 BKN015 15/14 Q1023 NOSIG= |
02 UTC: METAR HKJK 200200Z VRB03KT 9999 BKN015 14/13 Q1023 NOSIG= |
03 UTC: METAR HKJK 200300Z 22003KT 9999 BKN015 12/12 Q1022 TEMPO 0300 6000 BKN002 |
04 UTC: METAR HKJK 200400Z VRB01KT 1000 BCFG SCT003 OVC015 12/12 Q1023 BECMG FM0430 0600 FG BKN001= |
Satellite Products
Click the tabs to view animations of the night microphysics, fog, and water vapor satellite products from 00 to 04 UTC. Then answer the question below.
Night Microphysics RGB
Fog Product
Water Vapour
What has happened to the low cloud layer over Nairobi from 00 to 04 UTC? Select the correct option.
The correct answer is A.
The cloud layer near and east of Nairobi is slowly expanding.
Decision
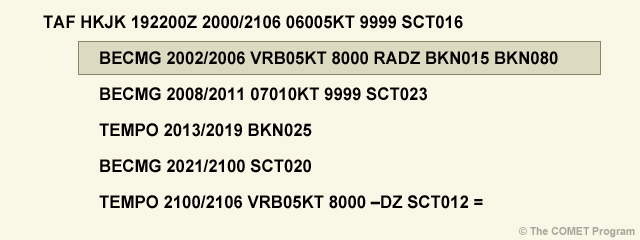
Based on the data through 04 UTC, is there any reason to amend the 00 UTC TAF? If not, click No Change Required below. If a section needs to be amended, choose it from the list below.
The correct answer is B.
The first change group (1) needs to be amended because patches of fog have formed at the airport and dropped the visibility to 1000 m. The second change group indicates that the stratus should disperse in the morning after sunrise. Since that's what we expected, it needs no amendment. The third change group does not need to be amended and, in any case, it will be updated in the next TAF.
Amending the TAF
Now we'll write the amendment. If you'd like guidance on how TAFs are formulated, access the Aviation Resources link to the left.
Here's the previous TAF valid from 00 UTC 20 July to 06 UTC 21 July.
Question 1: Re-write the highlighted change group by selecting the correct term for each group.
Since we anticipate that the fog and reduced visibility will persist, the TAF needs to be amended. Calming winds and horizontal visilibity of less than 1000 m need to be included.
Question 2: How does this portion of the amendment affect the forecast flight category? Select the correct option.
The correct answer is C.
An amendment to the TAF is necessary because of the significant drop in visibility and its impact on the flight categories, and the potential impact on aviation planning and operations.
Amended TAF and Impacts
Here is the amended TAF:
Based on the forecast, what aviation-related features or conditions might be of concern and need to be monitored over the next few hours? Select all that apply.
All of these are possible when fog is present and visibilities are so low.
What Happened?
Click the tabs to see what happened from 00 to 09 UTC 20 July. Then answer the question below.
Visible Imagery
Fog Product
METARS
METAR HKJK 200300Z 22003KT 9999 BKN015 12/12 Q1022 TEMPO 0300 6000 BKN002=
METAR HKJK 200400Z VRB01KT 1000 BCFG SCT003 OVC015 12/12 Q1023 BECMG FM0430 0600 FG BKNOOI=
METAR HKJK 200500Z 19004KT 0800 FG SCT001 OVC015 11/11 Q1024 TEMPO FM0600 3000 BKN001 OVC015=
METAR HKJK 200600Z 21006KT 4000 BKN003 BKN016 13/12 Q1025 TEMPO AT 0700 9999 SCT009 BKN018=
METAR HKJK 200700Z 20004KT 9999 SCT008 BKN017 14/12 Q1025 NOSIG=
METAR HKJK 200800Z 20006KT 9999 SCT010 BKN018 16/13 Q1025 NOSIG=
METAR HKJK 200900Z 19007KT 9999 SCT020 18/13 Q1024 NOSIG=
Synop Charts
How did the weather situation evolve? Select the correct option.
The correct answer is A.
According to the METAR observations, visibility was at its lowest at 05 UTC, 1.5 hours after local sunrise. No drizzle was observed, only patches of fog and fog, which lifted by 06 UTC. According to the satellite products, the low cloud layer remained over the Nairobi region the entire morning and broke up shortly after the 08 UTC time forecasted in the TAF. The 06 UTC synoptic chart indicates foggy conditions (in green) over the region with reduced visibility (as low as 800 m in Nairobi).
Summary
Fog and low stratus can have a significant impact on aviation operations through reduced ceiling and visibilities. Satellite imagery and products are very effective tools for detecting the presence of low clouds and fog, determining their aeral coverage, and monitoring their evolution. This is especially true of radiation fog, where the fog area tends to dissipate from the edges inward with daytime heating.
Since satellites look down on clouds, it is hard to distinguish areas of low cloud from fog (which starts at ground level). Therefore, it is vital to use all of your weather data and integrate satellite information with surface and upper air observations to determine where fog may actually be occurring.
Satellite and other observational data are vital tools for evaluating NWP guidance. Based on how the models initialize, you may need to adjust the model forecast before writing the details of your aviation forecast.